
Gildan Activewear, Inc. Class A Sub. Vot. (GIL): Price and Financial Metrics
GIL Price/Volume Stats
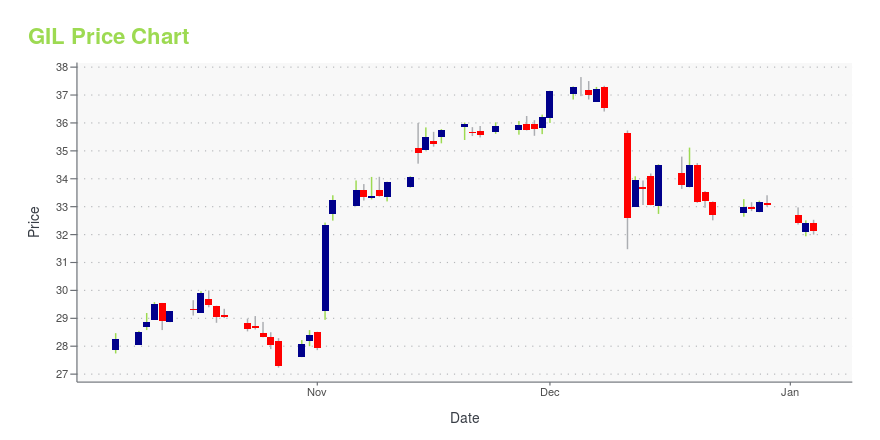
| Current price | $39.93 | 52-week high | $40.24 |
| Prev. close | $39.03 | 52-week low | $26.99 |
| Day low | $39.32 | Volume | 490,900 |
| Day high | $40.24 | Avg. volume | 764,269 |
| 50-day MA | $37.94 | Dividend yield | 2.08% |
| 200-day MA | $34.83 | Market Cap | 6.62B |
GIL Stock Price Chart Interactive Chart >
Gildan Activewear, Inc. Class A Sub. Vot. (GIL) Company Bio
Gildan Activewear is a leading supplier of quality branded basic family apparel, including T-shirts, fleece, sport shirts, underwear, socks, hosiery, and shapewear. The company was incorporated in 1984 and is based in Montreal, Canada.
Latest GIL News From Around the Web
Below are the latest news stories about GILDAN ACTIVEWEAR INC that investors may wish to consider to help them evaluate GIL as an investment opportunity.
Gildan Included on the Dow Jones Sustainability(TM) Index for the 11th Consecutive YearMONTREAL, QC / ACCESSWIRE / December 21, 2023 / Gildan Activewear Inc. (TSX:GIL) and (NYSE:GIL) ("Gildan" or "the Company") is pleased to share that it has been included on the Dow Jones Sustainability™ North America Index (DJSI North America) [1] ... |
UPDATE 2-Canadian activewear Gildan's board rejects shareholder calls to reinstate CEOCanadian apparel maker Gildan Activewear's board on Wednesday backed its decision to remove Glenn Chamandy from the CEO role, after some big shareholders called for his return. Eight investors, including hedge fund managers Browning West and Oakcliff Capital, have sent letters to the company's board expressing concerns over the leadership change as well as its invitation to a shareholder to join the board on certain conditions. Browning West, in a letter earlier in the day, said it was prepared to reconstitute the board through a special shareholders meeting if Gildan continues to ignore the feedback of more than 33% of shareholders. |
Gildan Activewear Chairman Says Former CEO Chamandy Refused to Abide Succession PlanGildan Activewear said it is standing by its newly appointed CEO, Vince Tyra, after former chief Glenn Chamandy refused to abide by the company’s succession plan. |
Canadian activewear Gildan's board rejects shareholder calls to reinstate CEO(Reuters) -Canadian apparel maker Gildan Activewear's board on Wednesday backed its decision to remove Glenn Chamandy from the CEO role, after some big shareholders called for his return. Eight investors, including hedge fund managers Browning West and Oakcliff Capital, have sent letters to the company's board expressing concerns over the leadership change as well as its invitation to a shareholder to join the board on certain conditions. Browning West, in a letter earlier in the day, said it was prepared to reconstitute the board through a special shareholders meeting if Gildan continues to ignore the feedback of more than 33% of shareholders. |
Gildan Activewear Directors Issue Open Letter to ShareholdersMONTREAL, Dec. 20, 2023 (GLOBE NEWSWIRE) -- The Chairman of the Board of Directors of Gildan Activewear Inc. (GIL: TSX and NYSE) (“Gildan” or “the Company”) and the Board’s Committee Chairs today issued an open letter to shareholders. Dear Fellow Gildan Shareholders: We are writing to you today to clarify the record as to why the directors of Gildan recently came to the unanimous decision to remove Glenn Chamandy as chief executive officer and to outline the path forward under our new CEO Vince |
GIL Price Returns
| 1-mo | 6.11% |
| 3-mo | 14.42% |
| 6-mo | 22.55% |
| 1-year | 34.11% |
| 3-year | 29.32% |
| 5-year | 12.92% |
| YTD | 23.66% |
| 2023 | 24.33% |
| 2022 | -33.55% |
| 2021 | 52.98% |
| 2020 | -4.46% |
| 2019 | -1.17% |
GIL Dividends
| Ex-Dividend Date | Type | Payout Amount | Change | ||||||
|---|---|---|---|---|---|---|---|---|---|
| Loading, please wait... | |||||||||
Continue Researching GIL
Want to see what other sources are saying about Gildan Activewear Inc's financials and stock price? Try the links below:Gildan Activewear Inc (GIL) Stock Price | Nasdaq
Gildan Activewear Inc (GIL) Stock Quote, History and News - Yahoo Finance
Gildan Activewear Inc (GIL) Stock Price and Basic Information | MarketWatch
Loading social stream, please wait...