General Mills, Inc. (GIS): Price and Financial Metrics

General Mills, Inc. (GIS): $70.24

0.58 (+0.83%)

POWR Rating

Component Grades

Momentum

D

Stability

B

Sentiment

Quality

B

Add GIS to Watchlist
Sign Up

Industry: Food Makers

Industry

C

Ranked

#31 of 77

in industry

GIS Price/Volume Stats

Current price $70.24 52-week high $90.89
Prev. close $69.66 52-week low $60.33
Day low $69.82 Volume 2,954,754
Day high $70.66 Avg. volume 4,302,171
50-day MA $65.26 Dividend yield 3.41%
200-day MA $67.65 Market Cap 39.89B

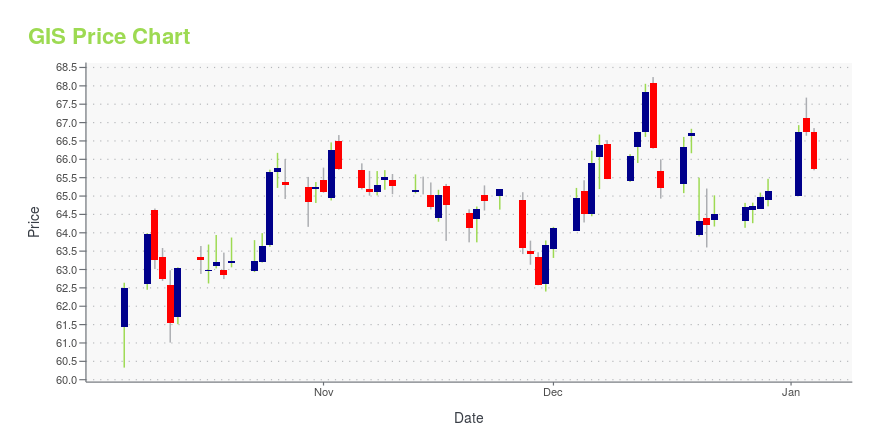
GIS Stock Price Chart Interactive Chart >

GIS POWR Grades

  • GIS scores best on the Quality dimension, with a Quality rank ahead of 82.03% of US stocks.
  • GIS's strongest trending metric is Stability; it's been moving down over the last 26 weeks.
  • GIS's current lowest rank is in the Momentum metric (where it is better than 13.82% of US stocks).

GIS Stock Summary

  • With a market capitalization of $37,895,306,373, GENERAL MILLS INC has a greater market value than 93.15% of US stocks.
  • GIS's went public 38.03 years ago, making it older than 92.92% of listed US stocks we're tracking.
  • Of note is the ratio of GENERAL MILLS INC's sales and general administrative expense to its total operating expenses; 80.56% of US stocks have a lower such ratio.
  • Stocks with similar financial metrics, market capitalization, and price volatility to GENERAL MILLS INC are HSY, NUE, CCEP, KHC, and DLTR.
  • GIS's SEC filings can be seen here. And to visit GENERAL MILLS INC's official web site, go to www.generalmills.com.

GIS Valuation Summary

  • GIS's price/earnings ratio is 15; this is 28.23% lower than that of the median Consumer Defensive stock.
  • GIS's EV/EBIT ratio has moved up 1.4 over the prior 243 months.

Below are key valuation metrics over time for GIS.

Stock Date P/S P/B P/E EV/EBIT
GIS 2023-12-22 1.8 3.9 15.0 14.2
GIS 2023-12-21 1.8 3.9 15.0 14.1
GIS 2023-12-20 1.8 3.9 15.0 14.2
GIS 2023-12-19 1.9 3.8 15.8 14.8
GIS 2023-12-18 1.9 3.8 15.8 14.7
GIS 2023-12-15 1.9 3.7 15.5 14.5

GIS Growth Metrics

    The 3 year price growth rate now stands at 33.01%.
  • The 3 year net income to common stockholders growth rate now stands at 49.74%.
  • Its 4 year revenue growth rate is now at 6.51%.
GIS's revenue has moved up $2,601,900,000 over the prior 34 months.

The table below shows GIS's growth in key financial areas (numbers in millions of US dollars).

Date Revenue Operating Cash Flow Net Income to Common Stock
2022-12-31 19,367.2 3,019 2,909
2022-09-30 19,170.5 3,335.1 2,900.3
2022-06-30 18,992.8 3,316.1 2,707.3
2022-03-31 18,625.2 3,003.4 2,301.3
2021-12-31 18,607.5 3,054.2 2,236.7
2021-09-30 18,302.9 2,769.4 2,327.9

GIS's Quality Factors

The “Quality” component of the POWR Ratings focuses on 31 different factors of a companies fundamentals and operational strength. Here are some key insights as we drill into the specifics of these quality attributes.
  • GIS has a Quality Grade of C, ranking ahead of 74.14% of graded US stocks.
  • GIS's asset turnover comes in at 0.567 -- ranking 38th of 59 Food Products stocks.
  • CAG, CPB, and PLAG are the stocks whose asset turnover ratios are most correlated with GIS.

The table below shows GIS's key quality metrics over time.

Period Asset Turnover Gross Margin ROIC
2021-08-29 0.567 0.353 0.242
2021-05-30 0.566 0.356 0.247
2021-02-28 0.587 0.356 0.263
2020-11-29 0.587 0.355 0.239
2020-08-30 0.586 0.352 0.226
2020-05-31 0.579 0.348 0.205

GIS Price Target

For more insight on analysts targets of GIS, see our GIS price target page. And for a list of of all stocks sorted by upside potential based on analyst target price, see our Top Price Target page.

Average Price Target $63.17 Average Broker Recommendation 1.95 (Hold)

General Mills, Inc. (GIS) Company Bio


General Mills sells products including ready-to-eat cereals; convenient meals, including meal kits, ethnic meals, pizza, soups, side dish mixes, frozen breakfast, and frozen entrees; snacks comprising grain, fruit, and savory snacks, as well as nutrition bars and frozen hot snacks; refrigerated yogurt products; ice creams; baking mixes and ingredients; refrigerated and frozen dough products; and frozen and shelf-stable vegetable products. The company was founded in 1928 and is based in Minneapolis, Minnesota.


GIS Latest News Stream


Event/Time News Detail
Loading, please wait...

GIS Latest Social Stream


Loading social stream, please wait...

View Full GIS Social Stream

Latest GIS News From Around the Web

Below are the latest news stories about GENERAL MILLS INC that investors may wish to consider to help them evaluate GIS as an investment opportunity.

Consumer Staples Sector Outlook: 3 Major Shifts Anticipated in 2024

The consumer staples trends in 2024 suggest that business could be much better in 2024 due to higher volumes and elevated prices.

Will Ashworth on InvestorPlace | December 30, 2023

Top 15 Value Stocks to Buy for 2024

In this article, we discuss top 15 value stocks to buy for 2024 picked by Joel Greenblatt. To skip the details about Mr. Greenblatt’s life, portfolio performance, and investment strategy, go directly to Top 5 Value Stocks to Buy for 2024. Investing offers an exciting and effective way of growing wealth over time. Value investing is […]

Yahoo | December 28, 2023

12 Highest Quality French Fries Brands in the US

In this article, we will look into the 12 highest quality French fries brands in the US. If you want to skip our detailed analysis, you can go directly to the 5 Highest Quality French Fries Brands in the US. French Fries Industry: A Market Analysis According to a report by Fortune Business Insights, the […]

Yahoo | December 28, 2023

Uncertainty Ahead for General Mills Despite Healthy 2nd-Quarter Margins

The company reported a mixed 2nd quarter, beating on the bottom line and producing strong free cash flow, but the next 12 months could be shaky

Yahoo | December 27, 2023

How Food Stocks Spoiled in 2023

Companies making packaged food were among the most notable U.S. stock underperformers of the year, and the causes were many. Next year might look better.

Yahoo | December 26, 2023

Read More 'GIS' Stories Here

GIS Price Returns

1-mo 9.39%
3-mo 8.82%
6-mo 11.84%
1-year -14.65%
3-year 23.35%
5-year 59.84%
YTD 8.82%
2023 -19.97%
2022 28.09%
2021 18.53%
2020 13.60%
2019 43.13%

GIS Dividends

Ex-Dividend Date Type Payout Amount Change
Loading, please wait...
View Full GIS Dividend History

Continue Researching GIS

Want to see what other sources are saying about General Mills Inc's financials and stock price? Try the links below:

General Mills Inc (GIS) Stock Price | Nasdaq
General Mills Inc (GIS) Stock Quote, History and News - Yahoo Finance
General Mills Inc (GIS) Stock Price and Basic Information | MarketWatch

Get Free Updates

Join thousands of investors who get the latest news, insights and top rated picks from StockNews.com!