Gladstone Capital Corporation (GLAD): Price and Financial Metrics
GET POWR RATINGS... FREE!
GLAD POWR Grades
- Sentiment is the dimension where GLAD ranks best; there it ranks ahead of 78.75% of US stocks.
- GLAD's strongest trending metric is Quality; it's been moving down over the last 179 days.
- GLAD's current lowest rank is in the Growth metric (where it is better than 6.35% of US stocks).
GLAD Stock Summary
- The ratio of debt to operating expenses for Gladstone Capital Corp is higher than it is for about 98.68% of US stocks.
- In terms of twelve month growth in earnings before interest and taxes, Gladstone Capital Corp is reporting a growth rate of 386.24%; that's higher than 94.45% of US stocks.
- In terms of volatility of its share price, GLAD is more volatile than only 1.56% of stocks we're observing.
- Stocks that are quantitatively similar to GLAD, based on their financial statements, market capitalization, and price volatility, are OFS, BIP, SLRC, TPVG, and ASR.
- GLAD's SEC filings can be seen here. And to visit Gladstone Capital Corp's official web site, go to www.gladstonecapital.com.
GLAD Valuation Summary
- GLAD's price/sales ratio is 7.6; this is 137.5% higher than that of the median Financial Services stock.
- GLAD's EV/EBIT ratio has moved up 922.3 over the prior 232 months.
- GLAD's price/sales ratio has moved down 433.9 over the prior 232 months.
Below are key valuation metrics over time for GLAD.
Stock | Date | P/S | P/B | P/E | EV/EBIT |
---|---|---|---|---|---|
GLAD | 2018-08-27 | 6.0 | 1.1 | 7.9 | 9.8 |
GLAD | 2011-07-21 | 6.2 | 0.9 | -48.1 | -108.0 |
GLAD | 2008-12-24 | 3.6 | 0.6 | -7.7 | -23.8 |
GLAD | 2007-11-29 | 8.6 | 1.3 | 14.9 | 17.8 |
GLAD | 2005-06-28 | 11.1 | 1.7 | 17.2 | 18.0 |
GLAD | 2004-01-28 | 15.4 | 1.8 | 21.1 | 19.0 |
GLAD Growth Metrics
- The year over year price growth rate now stands at 72.44%.
- Its 3 year cash and equivalents growth rate is now at -71.55%.
- Its 2 year net income to common stockholders growth rate is now at -145.7%.

The table below shows GLAD's growth in key financial areas (numbers in millions of US dollars).
Date | Revenue | Operating Cash Flow | Net Income to Common Stock |
---|---|---|---|
2021-12-31 | 57.079 | -32.051 | 84.099 |
2021-09-30 | 53.794 | -14.062 | 84.299 |
2021-06-30 | 52.012 | 16.144 | 61.803 |
2021-03-31 | 50.075 | -30.224 | 58.806 |
2020-12-31 | 48.682 | -9.579 | 9.732 |
2020-09-30 | 47.959 | -46.091 | -1.873 |
GLAD's Quality Factors
The “Quality” component of the POWR Ratings focuses on 31 different factors of a companies fundamentals and operational strength. Here are some key insights as we drill into the specifics of these quality attributes.- GLAD has a Quality Grade of C, ranking ahead of 65.17% of graded US stocks.
- GLAD's asset turnover comes in at 0.107 -- ranking 193rd of 443 Trading stocks.
- VIRT, APTS, and BDN are the stocks whose asset turnover ratios are most correlated with GLAD.
The table below shows GLAD's key quality metrics over time.
Period | Asset Turnover | Gross Margin | ROIC |
---|---|---|---|
2021-06-30 | 0.107 | 0.790 | 0.104 |
2021-03-31 | 0.107 | 0.798 | 0.100 |
2020-12-31 | 0.109 | 0.824 | 0.030 |
2020-09-30 | 0.109 | 0.838 | 0.013 |
2020-06-30 | 0.111 | 0.846 | 0.005 |
2020-03-31 | 0.117 | 0.835 | -0.006 |
GLAD Price Target
For more insight on analysts targets of GLAD, see our GLAD price target page. And for a list of of all stocks sorted by upside potential based on analyst target price, see our Top Price Target page.
Average Price Target | $9.50 | Average Broker Recommendation | 2 (Hold) |
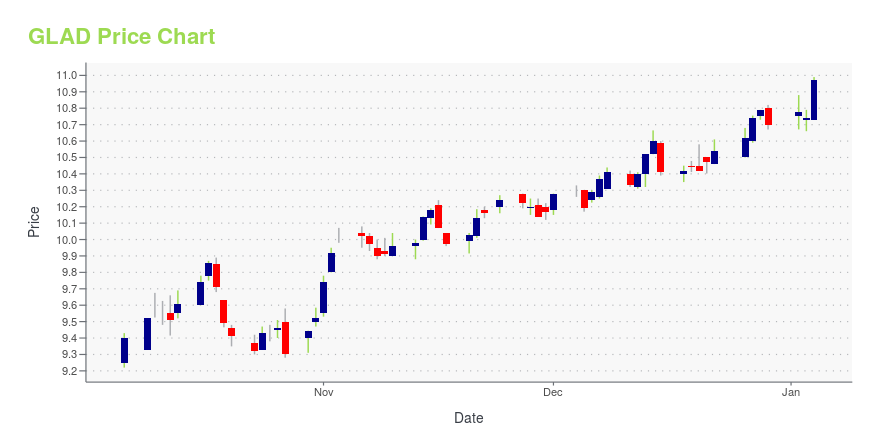
GLAD Stock Price Chart Interactive Chart >
GLAD Price/Volume Stats
Current price | $10.23 | 52-week high | $12.78 |
Prev. close | $10.09 | 52-week low | $9.43 |
Day low | $10.05 | Volume | 177,100 |
Day high | $10.24 | Avg. volume | 169,358 |
50-day MA | $11.10 | Dividend yield | 7.92% |
200-day MA | $11.37 | Market Cap | 350.93M |
Gladstone Capital Corporation (GLAD) Company Bio
Gladstone Investment Corporation is an externally managed, closed-end, non-diversified management investment company. The Company's investment objectives are to achieve and grow current income by investing in debt securities of established businesses that it believes will provide stable earnings and cash flow to pay expenses, make principal and interest payments on its outstanding indebtedness and make distributions to stockholders that grow over time, and provide its stockholders with long-term capital appreciation in the value of its assets by investing in equity securities. The company is based in McLean, Virginia.
Latest GLAD News From Around the Web
Below are the latest news stories about Gladstone Capital Corp that investors may wish to consider to help them evaluate GLAD as an investment opportunity.
BDC and REIT manager The Gladstone Companies files IPOThe Gladstone Companies on Monday filed its initial public offering to trade on the Nasdaq under the symbol GC, with underwriter EF Hutton, a division of Benchmark Investments LLC. The McLean, Va.-based company, headed by CEO David Gladstone, manages four publicly traded funds including two investment trusts, Gladstone Commercial Corp. and Gladstone Land Corp. , as well as specialty finance company Gladstone Capital Corp. and Gladstone Investment Corp. [a: gain], a business development company. Gladstone Securities LLC is an affiliated broker-dealer of The Gladstone Companies. The Gladstone Companies reported total assets under management of $4 billion as of Dec. 31. Its compound annual growth rate for its AUM is 18% over the past 20 years. Market Pulse Stories are Rapid-fire, short new... |
McCarthy Asset Management, Inc. Buys ARK Innovation ETF, Parker Hannifin Corp, Adient PLC, ...Investment company McCarthy Asset Management, Inc. (Current Portfolio) buys ARK Innovation ETF, Parker Hannifin Corp, Adient PLC, ARK Genomic Revolution ETF, Ranger Oil Corp, sells , The Trade Desk Inc, Vanguard Growth ETF, 3M Co, Vanguard Value ETF during the 3-months ended 2021Q4, according to the most recent filings of the investment company, McCarthy Asset Management, Inc.. |
10 Monthly Dividend Stocks with Over 5% YieldIn this article, we discuss 10 monthly dividend stocks with over 5% yield. If you want to skip our detailed analysis of these stocks, go directly to 5 Monthly Dividend Stocks with Over 5% Yield. Dividend paying stocks are considered to be a reliable hedge against the rising inflation that is expected to last for […] |
Gladstone Capital (GLAD) Q1 Earnings and Revenues Top EstimatesGladstone Capital (GLAD) delivered earnings and revenue surprises of 35% and 12.74%, respectively, for the quarter ended December 2021. Do the numbers hold clues to what lies ahead for the stock? |
Gladstone Capital GAAP EPS of $0.20 in-line, revenue of $16.17M beats by $1.66M (NASDAQ:GLAD)Gladstone Capital press release (GLAD): FQ1 GAAP EPS of $0.20 in-line.Revenue of $16.17M (+25.5% Y/Y) beats by $1.66M. |
GLAD Price Returns
1-mo | -8.92% |
3-mo | -12.61% |
6-mo | -5.58% |
1-year | N/A |
3-year | 38.96% |
5-year | 59.73% |
YTD | -8.59% |
2021 | 40.50% |
2020 | -0.69% |
2019 | 47.47% |
2018 | -13.07% |
2017 | 7.05% |
GLAD Dividends
Ex-Dividend Date | Type | Payout Amount | Change | ||||||
---|---|---|---|---|---|---|---|---|---|
Loading, please wait... |
Continue Researching GLAD
Here are a few links from around the web to help you further your research on Gladstone Capital Corp's stock as an investment opportunity:Gladstone Capital Corp (GLAD) Stock Price | Nasdaq
Gladstone Capital Corp (GLAD) Stock Quote, History and News - Yahoo Finance
Gladstone Capital Corp (GLAD) Stock Price and Basic Information | MarketWatch
Loading social stream, please wait...