
Glen Burnie Bancorp (GLBZ): Price and Financial Metrics
GLBZ Price/Volume Stats
| Current price | $4.70 | 52-week high | $8.25 |
| Prev. close | $4.59 | 52-week low | $3.37 |
| Day low | $4.61 | Volume | 12,966 |
| Day high | $4.76 | Avg. volume | 7,751 |
| 50-day MA | $4.27 | Dividend yield | 8.87% |
| 200-day MA | $5.45 | Market Cap | 13.60M |
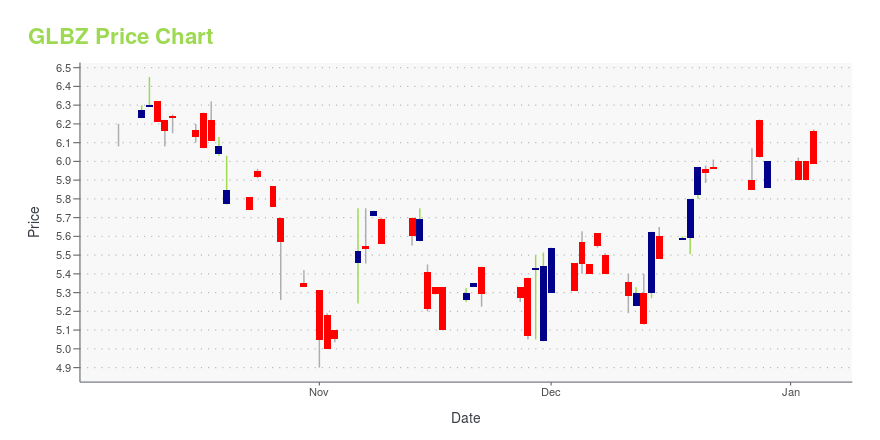
GLBZ Stock Price Chart Interactive Chart >
Glen Burnie Bancorp (GLBZ) Company Bio
Glen Burnie Bancorp operates as the bank holding company for The Bank of Glen Burnie that provides commercial and retail banking services to individuals, associations, partnerships, and corporations. The company accepts various deposits, including savings accounts, money market deposit accounts, demand deposit accounts, NOW checking accounts, IRA and SEP accounts, and certificates of deposit. It also provides residential and commercial real estate, construction, land acquisition and development, and secured and unsecured commercial loans, as well as consumer installment lending, such as indirect automobile lending services; and residential first and second mortgage loans, home equity lines of credit, and commercial mortgage loans. In addition, the company offers ancillary products and services comprising safe deposit boxes, money orders, night depositories, automated clearinghouse transactions, automated teller machine services, and telephone and Internet banking services. Further, it provides treasury services, including wire transfer and ACH services, and debit cards; and telephone, mobile, and Internet banking services, as well as Internet bill paying services. Additionally, the company engages in the business of acquiring, holding, and disposing of real property. It serves customers in northern Anne Arundel county and surrounding areas from its main office and branch in Glen Burnie, Maryland; and branch offices in Odenton, Riviera Beach, Crownsville, Severn, Linthicum, and Severna Park, Maryland. The company also has a remote ATM located in Pasadena, Maryland. Glen Burnie Bancorp was founded in 1949 and is based in Glen Burnie, Maryland.
Latest GLBZ News From Around the Web
Below are the latest news stories about GLEN BURNIE BANCORP that investors may wish to consider to help them evaluate GLBZ as an investment opportunity.
Glen Burnie Bancorp Announces Third Quarter 2023 ResultsGLEN BURNIE, Md., Oct. 31, 2023 (GLOBE NEWSWIRE) -- Glen Burnie Bancorp (“Bancorp”) (NASDAQ: GLBZ), the bank holding company for The Bank of Glen Burnie (“Bank”), announced today net income of $551,000, or $0.19 per basic and diluted common share for the three-month period ended September 30, 2023, compared to net income of $375,000, or $0.13 per basic and diluted common share for the three-month period ended September 30, 2022. Bancorp reported net income of $1.3 million, or $0.44 per basic and |
Glen Burnie Bancorp (NASDAQ:GLBZ) Has Announced A Dividend Of $0.10Glen Burnie Bancorp ( NASDAQ:GLBZ ) has announced that it will pay a dividend of $0.10 per share on the 6th of... |
Glen Burnie Bancorp Declares 3Q 2023 DividendGLEN BURNIE, Md., Oct. 13, 2023 (GLOBE NEWSWIRE) -- Glen Burnie Bancorp (NASDAQ: GLBZ), parent company of The Bank of Glen Burnie®, announced that its Board of Directors declared a regular dividend of ten cents ($0.10) per share of common stock at their meeting on October 12, 2023. This action marks the company’s 125th consecutive dividend. The regular dividend is payable on November 6, 2023, to shareholders of record at the close of business on October 23, 2023. Glen Burnie Bancorp, parent comp |
Bank of Glen Burnie taps Virginia banker as next CEOMark C. Hanna, the bank's next CEO, has spent more than 30 years working for Virginia community banks. |
Glen Burnie Bancorp Names Mark Hanna as New President and CEOGLEN BURNIE, Md., Sept. 20, 2023 (GLOBE NEWSWIRE) -- Glen Burnie Bancorp (NASDAQ: GLBZ), parent company of The Bank of Glen Burnie®, announced today that Mark C. Hanna will become President and CEO at Glen Burnie Bancorp and The Bank of Glen Burnie, succeeding John D. Long, who earlier this year announced his intent to retire. Mr. Hanna will join The Bank of Glen Burnie on October 2, 2023 as Executive Vice President, and, upon Mr. Long’s retirement effective October 16, 2023, Mr. Hanna will move |
GLBZ Price Returns
| 1-mo | 23.18% |
| 3-mo | -4.50% |
| 6-mo | -26.16% |
| 1-year | -37.12% |
| 3-year | N/A |
| 5-year | -45.64% |
| YTD | -17.13% |
| 2023 | N/A |
| 2022 | 0.00% |
| 2021 | 31.68% |
| 2020 | -0.34% |
| 2019 | 14.48% |
GLBZ Dividends
| Ex-Dividend Date | Type | Payout Amount | Change | ||||||
|---|---|---|---|---|---|---|---|---|---|
| Loading, please wait... | |||||||||
Continue Researching GLBZ
Here are a few links from around the web to help you further your research on Glen Burnie Bancorp's stock as an investment opportunity:Glen Burnie Bancorp (GLBZ) Stock Price | Nasdaq
Glen Burnie Bancorp (GLBZ) Stock Quote, History and News - Yahoo Finance
Glen Burnie Bancorp (GLBZ) Stock Price and Basic Information | MarketWatch
Loading social stream, please wait...