
Gaming and Leisure Properties, Inc. (GLPI): Price and Financial Metrics
GLPI Price/Volume Stats
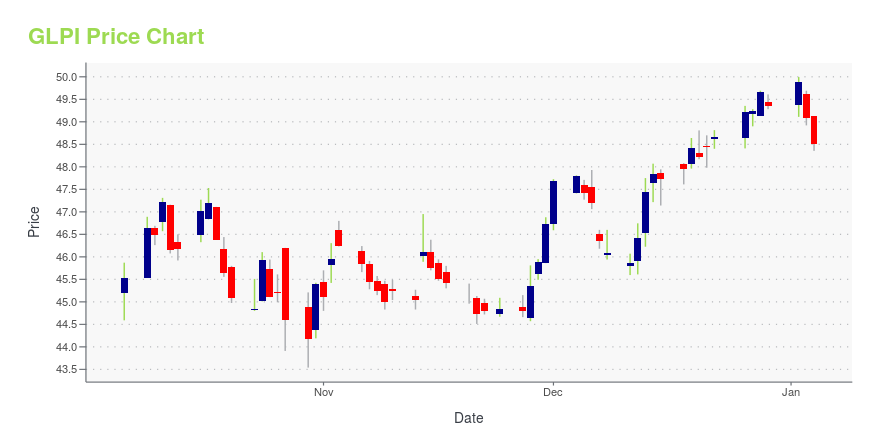
| Current price | $49.45 | 52-week high | $49.99 |
| Prev. close | $48.98 | 52-week low | $41.80 |
| Day low | $48.35 | Volume | 1,425,900 |
| Day high | $49.70 | Avg. volume | 1,340,047 |
| 50-day MA | $45.53 | Dividend yield | 6.22% |
| 200-day MA | $45.64 | Market Cap | 13.43B |
GLPI Stock Price Chart Interactive Chart >
Gaming and Leisure Properties, Inc. (GLPI) Company Bio
Gaming & Leisure Properties is engaged in the business of acquiring, financing, and owning real estate property to be leased to gaming operators in triple-net lease arrangements. The company was established in 2013 and is based in Wyomissing, PA.
Latest GLPI News From Around the Web
Below are the latest news stories about GAMING & LEISURE PROPERTIES INC that investors may wish to consider to help them evaluate GLPI as an investment opportunity.
Best Casinos in Each of 30 Biggest Cities in the USIn this article, we will look into the best casinos in each of the 30 biggest US cities. If you want to skip our detailed analysis, you can go directly to the 5 Best Casinos in the Biggest Cities in the US. US Casino Gaming Market: An Analysis According to a report by Technavio, the […] |
Gaming and Leisure Properties (GLPI) Upgraded to Buy: Here's What You Should KnowGaming and Leisure Properties (GLPI) might move higher on growing optimism about its earnings prospects, which is reflected by its upgrade to a Zacks Rank #2 (Buy). |
Hedge Funds are Betting on These 14 Sliding StocksIn this article, we will take a look at the hedge funds that are betting on these 14 sliding stocks. To see more such companies, go directly to Hedge Funds are Betting on These 5 Sliding Stocks. Stocks jumped on December 6 after the release of yet another welcome data point for the Federal Reserve, […] |
Gaming and Leisure Properties, Inc. Declares Fourth Quarter 2023 Cash Dividend of $0.73 Per ShareWYOMISSING, Pa., Nov. 22, 2023 (GLOBE NEWSWIRE) -- Gaming and Leisure Properties, Inc. (NASDAQ: GLPI) (the “Company”), announced today that the Company’s Board of Directors has declared the fourth quarter 2023 cash dividend of $0.73 per share of its common stock. The dividend is payable on December 22, 2023 to shareholders of record on December 8, 2023. The fourth quarter 2022 cash dividend was $0.705 per share of the Company’s common stock. While the Company intends to pay regular quarterly cas |
Gaming and Leisure Properties Applauds Major League Baseball’s Landmark Decision to Bring the MLB Athletics to Las VegasWYOMISSING, Pa., Nov. 16, 2023 (GLOBE NEWSWIRE) -- Gaming and Leisure Properties, Inc. (“GLPI”) (NASDAQ: GLPI) today issued the following statement following the announcement by Major League Baseball (“MLB”) that the league’s owners have approved the move of MLB’s Athletics (“A’s”) franchise to Las Vegas: “Today’s approval from Major League Baseball represents an important milestone in the collective effort to bring the Athletics’ franchise to Las Vegas. We are excited about the opportunity to w |
GLPI Price Returns
| 1-mo | 10.65% |
| 3-mo | 18.47% |
| 6-mo | 11.07% |
| 1-year | 11.11% |
| 3-year | 25.53% |
| 5-year | 81.65% |
| YTD | 3.63% |
| 2023 | 0.92% |
| 2022 | 13.49% |
| 2021 | 22.10% |
| 2020 | 5.61% |
| 2019 | 42.88% |
GLPI Dividends
| Ex-Dividend Date | Type | Payout Amount | Change | ||||||
|---|---|---|---|---|---|---|---|---|---|
| Loading, please wait... | |||||||||
Continue Researching GLPI
Want to do more research on Gaming & Leisure Properties Inc's stock and its price? Try the links below:Gaming & Leisure Properties Inc (GLPI) Stock Price | Nasdaq
Gaming & Leisure Properties Inc (GLPI) Stock Quote, History and News - Yahoo Finance
Gaming & Leisure Properties Inc (GLPI) Stock Price and Basic Information | MarketWatch
Loading social stream, please wait...