Corning Inc. (GLW): Price and Financial Metrics
GET POWR RATINGS... FREE!
GLW POWR Grades
- Quality is the dimension where GLW ranks best; there it ranks ahead of 72.7% of US stocks.
- The strongest trend for GLW is in Quality, which has been heading up over the past 179 days.
- GLW ranks lowest in Growth; there it ranks in the 16th percentile.
GLW Stock Summary
- GLW has a higher market value than 91.42% of US stocks; more precisely, its current market capitalization is $32,412,952,763.
- GLW's went public 36.27 years ago, making it older than 92.84% of listed US stocks we're tracking.
- In terms of volatility of its share price, GLW is more volatile than only 9.85% of stocks we're observing.
- If you're looking for stocks that are quantitatively similar to Corning Inc, a group of peers worth examining would be ENTG, TRMB, KEYS, FSLR, and ZBRA.
- Visit GLW's SEC page to see the company's official filings. To visit the company's web site, go to www.corning.com.
GLW Valuation Summary
- In comparison to the median Technology stock, GLW's price/earnings ratio is 50.26% lower, now standing at 19.4.
- Over the past 243 months, GLW's price/sales ratio has gone up 1.2.
- GLW's price/sales ratio has moved up 1.2 over the prior 243 months.
Below are key valuation metrics over time for GLW.
Stock | Date | P/S | P/B | P/E | EV/EBIT |
---|---|---|---|---|---|
GLW | 2021-09-01 | 2.5 | 2.8 | 19.4 | 15.9 |
GLW | 2021-08-31 | 2.6 | 2.9 | 19.8 | 16.2 |
GLW | 2021-08-30 | 2.6 | 2.9 | 19.8 | 16.2 |
GLW | 2021-08-27 | 2.6 | 2.9 | 20.2 | 16.5 |
GLW | 2021-08-26 | 2.6 | 2.9 | 19.9 | 16.3 |
GLW | 2021-08-25 | 2.7 | 2.9 | 20.2 | 16.5 |
GLW Growth Metrics
- The year over year net cashflow from operations growth rate now stands at 15.03%.
- The 3 year net income to common stockholders growth rate now stands at 281.91%.
- Its 4 year price growth rate is now at 10.71%.

The table below shows GLW's growth in key financial areas (numbers in millions of US dollars).
Date | Revenue | Operating Cash Flow | Net Income to Common Stock |
---|---|---|---|
2021-12-31 | 14,082 | 3,412 | 1,079 |
2021-09-30 | 13,756 | 3,163 | 868 |
2021-06-30 | 13,142 | 2,876 | 924 |
2021-03-31 | 12,202 | 2,655 | 1,207 |
2020-12-31 | 11,303 | 2,180 | 512 |
2020-09-30 | 10,770 | 2,424 | 292 |
GLW's Quality Factors
The “Quality” component of the POWR Ratings focuses on 31 different factors of a companies fundamentals and operational strength. Here are some key insights as we drill into the specifics of these quality attributes.- GLW has a Quality Grade of C, ranking ahead of 74.6% of graded US stocks.
- GLW's asset turnover comes in at 0.457 -- ranking 36th of 40 Steel Works Etc stocks.
- CENX, TWI, and AA are the stocks whose asset turnover ratios are most correlated with GLW.
The table below shows GLW's key quality metrics over time.
Period | Asset Turnover | Gross Margin | ROIC |
---|---|---|---|
2021-09-30 | 0.457 | 0.364 | 0.090 |
2021-06-30 | 0.434 | 0.356 | 0.087 |
2021-03-31 | 0.411 | 0.338 | 0.066 |
2020-12-31 | 0.388 | 0.312 | 0.032 |
2020-09-30 | 0.376 | 0.295 | 0.021 |
2020-06-30 | 0.384 | 0.298 | 0.019 |
GLW Price Target
For more insight on analysts targets of GLW, see our GLW price target page. And for a list of of all stocks sorted by upside potential based on analyst target price, see our Top Price Target page.
Average Price Target | $48.45 | Average Broker Recommendation | 1.46 (Moderate Buy) |
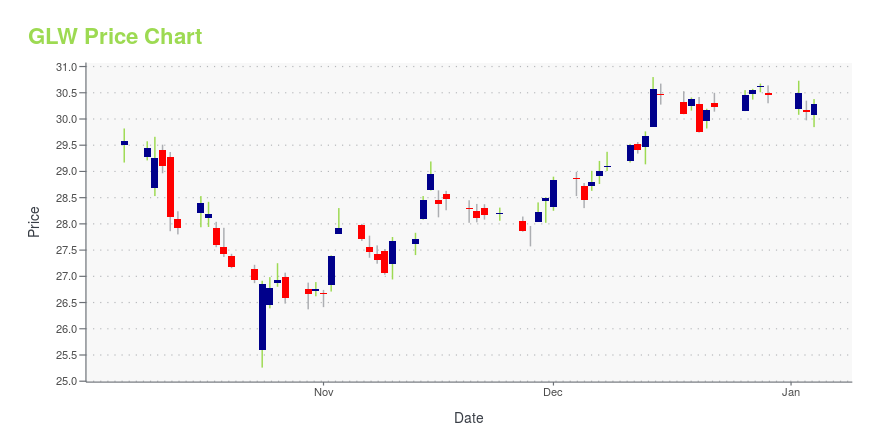
GLW Stock Price Chart Interactive Chart >
GLW Price/Volume Stats
Current price | $33.70 | 52-week high | $44.17 |
Prev. close | $33.27 | 52-week low | $32.24 |
Day low | $32.94 | Volume | 5,131,892 |
Day high | $33.84 | Avg. volume | 5,212,727 |
50-day MA | $35.67 | Dividend yield | 3.2% |
200-day MA | $37.79 | Market Cap | 28.46B |
Corning Inc. (GLW) Company Bio
Corning Incorporated is an American multinational technology company that specializes in specialty glass, ceramics, and related materials and technologies including advanced optics, primarily for industrial and scientific applications. The company was named Corning Glass Works until 1989. Corning divested its consumer product lines (including CorningWare and Visions Pyroceram-based cookware, Corelle Vitrelle tableware, and Pyrex glass bakeware) in 1998 by selling the Corning Consumer Products Company subsidiary (now known as Corelle Brands) to Borden, but still holds an interest of about 8 percent. (Source:Wikipedia)
Latest GLW News From Around the Web
Below are the latest news stories about Corning Inc that investors may wish to consider to help them evaluate GLW as an investment opportunity.
Corning Incorporated Consensus Indicates Potential 13.1% UpsideCorning Incorporated with ticker code (GLW) have now 12 analysts covering the stock. The analyst consensus points to a rating of ''Buy''. The range between the high target price and low target price is between 52 and 40 calculating the average target price we see 47.17. Given that the stocks previous close was at 41.7 this would indicate that there is a potential upside of 13.1%. The day 50 moving average is 38.85 while the 200 day moving average is 39.55. The market cap for the company is $34,781m. Company Website: https://www.corning.com [stock_market_widget type="chart" template="basic" color="green" assets=GLW" range="6mo" interval="1d" axes="true" cursor="true" api="yf"] The potential market cap would be $39,344m based on the market concensus. Corning Incorporated engages in displa... |
We Are Progressing - Weekly Blog # 721This is a blog on investing and is not intended to express any political views. Every single action we take, including taking no action, is an action. Every single action we take has less of a future impact for those we care for emotionally or legally, be they the next... |
Corning: Consistent Return During Unstable TimesNo summary available. |
Four Days Left Until Corning Incorporated (NYSE:GLW) Trades Ex-DividendCorning Incorporated ( NYSE:GLW ) stock is about to trade ex-dividend in four days. The ex-dividend date is usually set... |
Corning Incorporated – Consensus Indicates Potential 14.2% UpsideCorning Incorporated found using ticker (GLW) have now 12 analysts covering the stock. The analyst consensus points to a rating of ''Buy''. The range between the high target price and low target price is between 52 and 40 and has a mean target at 47.17. Given that the stocks previous close was at 41.29 this would imply there is a potential upside of 14.2%. The 50 day moving average now sits at 38.45 while the 200 day moving average is 39.65. The market capitalisation for the company is $34,935m. Visit the company website at: https://www.corning.com [stock_market_widget type="chart" symbol="GLW" chart="bar" range="6mo" interval="1d" line-color="rgb(49, 125, 189)"] The potential market cap would be $39,910m based on the market concensus. Corning Incorporated engages in display technologie... |
GLW Price Returns
1-mo | -2.09% |
3-mo | -16.25% |
6-mo | -10.63% |
1-year | -21.18% |
3-year | 23.26% |
5-year | 30.03% |
YTD | -8.87% |
2021 | 5.92% |
2020 | 27.57% |
2019 | -1.02% |
2018 | -3.28% |
2017 | 34.63% |
GLW Dividends
Ex-Dividend Date | Type | Payout Amount | Change | ||||||
---|---|---|---|---|---|---|---|---|---|
Loading, please wait... |
Continue Researching GLW
Want to see what other sources are saying about Corning Inc's financials and stock price? Try the links below:Corning Inc (GLW) Stock Price | Nasdaq
Corning Inc (GLW) Stock Quote, History and News - Yahoo Finance
Corning Inc (GLW) Stock Price and Basic Information | MarketWatch
Loading social stream, please wait...