
GameStop Corp. Cl A (GME): Price and Financial Metrics
GME Price/Volume Stats
| Current price | $24.13 | 52-week high | $64.83 |
| Prev. close | $23.95 | 52-week low | $9.95 |
| Day low | $24.11 | Volume | 6,833,800 |
| Day high | $24.77 | Avg. volume | 25,291,551 |
| 50-day MA | $25.68 | Dividend yield | N/A |
| 200-day MA | $17.23 | Market Cap | 8.47B |
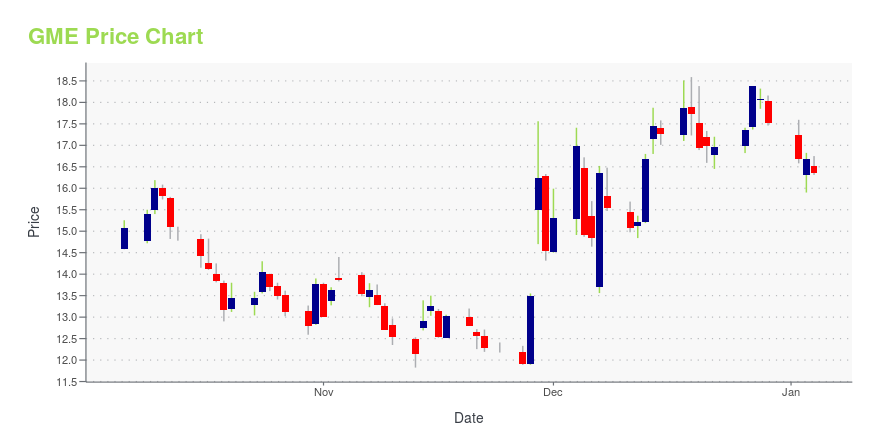
GME Stock Price Chart Interactive Chart >
GameStop Corp. Cl A (GME) Company Bio
GameStop Corp. is an American video game, consumer electronics, and gaming merchandise retailer. The company is headquartered in Grapevine, Texas (a suburb of Dallas), and is the largest video game retailer worldwide. As of 29 January 2022, the company operates 4,573 stores including 3,018 in the United States, 231 in Canada, 417 in Australia and 907 in Europe under the GameStop, EB Games, EB Games Australia, Micromania-Zing, ThinkGeek and Zing Pop Culture brands. The company was founded in Dallas in 1984 as Babbage's, and took on its current name in 1999. (Source:Wikipedia)
Latest GME News From Around the Web
Below are the latest news stories about GAMESTOP CORP that investors may wish to consider to help them evaluate GME as an investment opportunity.
3 Meme Stocks that Have Nowhere to Go But Down in 2024Various meme stocks are overvalued after rebounding in 2023 and Roundhill's MEME ETF closure offers testimony. |
7 Stocks that Multiple AI Bots Predict Will Soar in the Near FutureAI chatbots including ChatGPT and Bard believe these stocks are headed higher in the future, perhaps the near future. |
Smart Shorts: 7 Meme Stocks to Bet Against in 2024These seven meme stocks have surged as speculators declare "the coast is clear," but a big reversal for each of them may be forthcoming. |
Why You Should Bet on 5 Top-Ranked Stocks With Rising P/ETap four stocks with increasing P/E ratios to try out an out-of-the-box approach. These stocks include DouYu International (DOYU), Regis (RGS), 2seventy bio Inc. (TSVT), atai Life Sciences (ATAI) and GameStop (GME). |
GameStop (GME): Strong Industry, Solid Earnings Estimate RevisionsGameStop (GME) has seen solid earnings estimate revision activity over the past month, and belongs to a strong industry as well. |
GME Price Returns
| 1-mo | -0.29% |
| 3-mo | 102.77% |
| 6-mo | 66.53% |
| 1-year | 8.60% |
| 3-year | -45.94% |
| 5-year | 2,306.98% |
| YTD | 37.65% |
| 2023 | -5.04% |
| 2022 | -50.24% |
| 2021 | 687.63% |
| 2020 | 209.87% |
| 2019 | -50.19% |
Continue Researching GME
Want to see what other sources are saying about GameStop Corp's financials and stock price? Try the links below:GameStop Corp (GME) Stock Price | Nasdaq
GameStop Corp (GME) Stock Quote, History and News - Yahoo Finance
GameStop Corp (GME) Stock Price and Basic Information | MarketWatch
Loading social stream, please wait...