
Genie Energy Ltd. Class B Stock (GNE): Price and Financial Metrics
GNE Price/Volume Stats
| Current price | $25.04 | 52-week high | $28.47 |
| Prev. close | $24.65 | 52-week low | $13.05 |
| Day low | $24.09 | Volume | 151,700 |
| Day high | $25.04 | Avg. volume | 119,016 |
| 50-day MA | $20.77 | Dividend yield | 1.12% |
| 200-day MA | $16.64 | Market Cap | 672.22M |
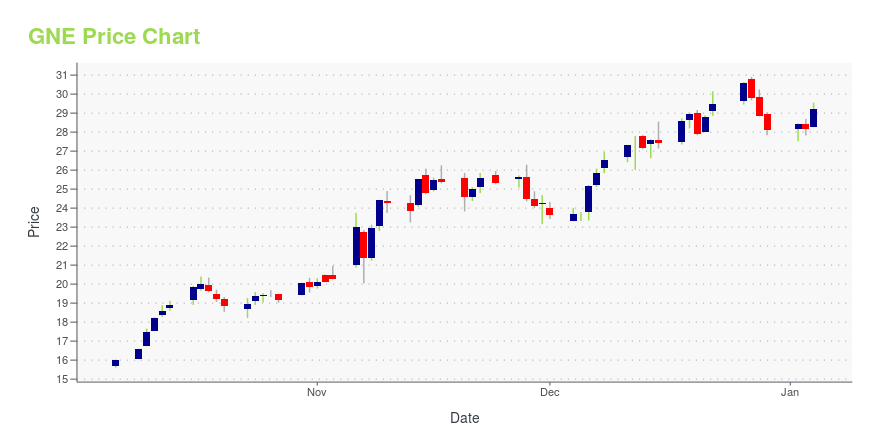
GNE Stock Price Chart Interactive Chart >
Genie Energy Ltd. Class B Stock (GNE) Company Bio
Genie Energy Ltd. operates as a retail energy provider and an oil and gas exploration company. The company was founded in 2001 and is based in Newark, New Jersey.
GNE Price Returns
| 1-mo | 14.70% |
| 3-mo | 67.95% |
| 6-mo | 62.13% |
| 1-year | N/A |
| 3-year | 212.50% |
| 5-year | N/A |
| YTD | 62.13% |
| 2024 | -43.56% |
| 2023 | 177.26% |
| 2022 | 94.28% |
| 2021 | -22.75% |
| 2020 | -2.76% |
GNE Dividends
| Ex-Dividend Date | Type | Payout Amount | Change | ||||||
|---|---|---|---|---|---|---|---|---|---|
| Loading, please wait... | |||||||||
Continue Researching GNE
Here are a few links from around the web to help you further your research on Genie Energy Ltd's stock as an investment opportunity:Genie Energy Ltd (GNE) Stock Price | Nasdaq
Genie Energy Ltd (GNE) Stock Quote, History and News - Yahoo Finance
Genie Energy Ltd (GNE) Stock Price and Basic Information | MarketWatch
Loading social stream, please wait...