
Genie Energy Ltd. Class B Stock (GNE): Price and Financial Metrics
GNE Price/Volume Stats
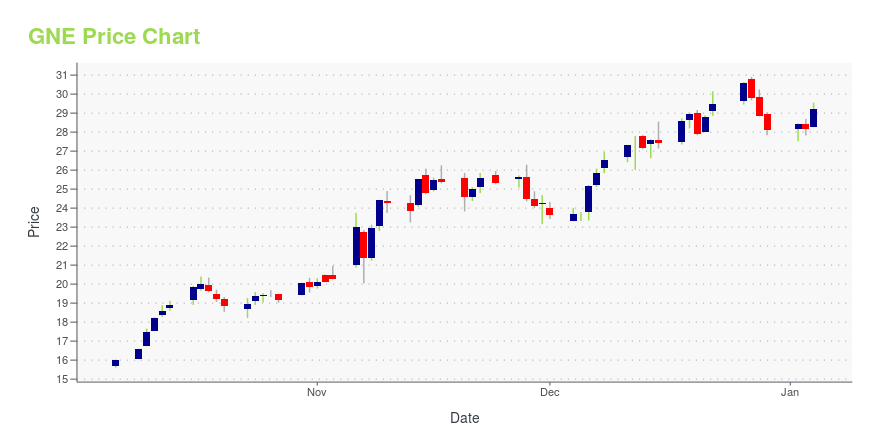
| Current price | $15.51 | 52-week high | $30.90 |
| Prev. close | $15.70 | 52-week low | $12.95 |
| Day low | $15.41 | Volume | 62,900 |
| Day high | $15.81 | Avg. volume | 169,448 |
| 50-day MA | $16.48 | Dividend yield | 1.86% |
| 200-day MA | $18.75 | Market Cap | 424.35M |
GNE Stock Price Chart Interactive Chart >
Genie Energy Ltd. Class B Stock (GNE) Company Bio
Genie Energy Ltd. operates as a retail energy provider and an oil and gas exploration company. The company was founded in 2001 and is based in Newark, New Jersey.
Latest GNE News From Around the Web
Below are the latest news stories about GENIE ENERGY LTD that investors may wish to consider to help them evaluate GNE as an investment opportunity.
6 A-Rated Utilities Stocks You Won’t RegretEven when the market is uncertain and energy prices are depressed, these utilities stocks brought in great returns and many pay a dividend. |
Genie Energy Ltd.'s (NYSE:GNE) top owners are individual investors with 46% stake, while 33% is held by institutionsKey Insights Significant control over Genie Energy by individual investors implies that the general public has more... |
Insider Sell: Director James Courter Sells 12,725 Shares of Genie Energy Ltd (GNE)James Courter, a notable director at Genie Energy Ltd (NYSE:GNE), has recently sold 12,725 shares of the company's stock. |
Sunlight Energy Investments Acquires Portfolio of Solar ProjectsAcquires Operational Arrays Aggregating 9.4 MW NEWARK, NJ, Nov. 27, 2023 (GLOBE NEWSWIRE) -- Sunlight Energy Investments (Sunlight Energy), a subsidiary of Genie Energy Ltd., (NYSE: GNE), a retail energy and renewable energy solutions provider, today announced that it has purchased a portfolio of 12 operating solar arrays with an aggregate rating of 9.4 MW-DC from the project developer. The arrays supply power to on-site school facilities in Ohio and Michigan, and their production is covered und |
Insider Sell Alert: Director James Courter Sells 27,275 Shares of Genie Energy Ltd (GNE)Director James Courter has recently made a significant sale of shares in Genie Energy Ltd (NYSE:GNE), a move that has caught the attention of investors and market analysts alike. |
GNE Price Returns
| 1-mo | 2.85% |
| 3-mo | -20.02% |
| 6-mo | -22.21% |
| 1-year | 1.33% |
| 3-year | 189.37% |
| 5-year | 108.62% |
| YTD | -44.64% |
| 2023 | 177.26% |
| 2022 | 94.28% |
| 2021 | -22.75% |
| 2020 | -2.76% |
| 2019 | 32.91% |
GNE Dividends
| Ex-Dividend Date | Type | Payout Amount | Change | ||||||
|---|---|---|---|---|---|---|---|---|---|
| Loading, please wait... | |||||||||
Continue Researching GNE
Here are a few links from around the web to help you further your research on Genie Energy Ltd's stock as an investment opportunity:Genie Energy Ltd (GNE) Stock Price | Nasdaq
Genie Energy Ltd (GNE) Stock Quote, History and News - Yahoo Finance
Genie Energy Ltd (GNE) Stock Price and Basic Information | MarketWatch
Loading social stream, please wait...