Genco Shipping & Trading Ltd. (GNK): Price and Financial Metrics
GET POWR RATINGS... FREE!
GNK POWR Grades
- GNK scores best on the Growth dimension, with a Growth rank ahead of 97.56% of US stocks.
- GNK's strongest trending metric is Momentum; it's been moving up over the last 179 days.
- GNK ranks lowest in Stability; there it ranks in the 18th percentile.
GNK Stock Summary
- With a price/earnings ratio of 5.36, Genco Shipping & Trading Ltd P/E ratio is greater than that of about only 7.48% of stocks in our set with positive earnings.
- With a year-over-year growth in debt of -45.2%, Genco Shipping & Trading Ltd's debt growth rate surpasses only 8.81% of about US stocks.
- Genco Shipping & Trading Ltd's shareholder yield -- a measure of how much capital is returned to stockholders via dividends and buybacks -- is 22.83%, greater than the shareholder yield of 92.32% of stocks in our set.
- If you're looking for stocks that are quantitatively similar to Genco Shipping & Trading Ltd, a group of peers worth examining would be SXC, CEIX, CLDT, MTDR, and RLJ.
- GNK's SEC filings can be seen here. And to visit Genco Shipping & Trading Ltd's official web site, go to www.gencoshipping.com.
GNK Valuation Summary
- GNK's price/sales ratio is 2.1; this is 36.36% lower than that of the median Industrials stock.
- Over the past 87 months, GNK's EV/EBIT ratio has gone NA NA.
- GNK's price/sales ratio has moved NA NA over the prior 87 months.
Below are key valuation metrics over time for GNK.
Stock | Date | P/S | P/B | P/E | EV/EBIT |
---|---|---|---|---|---|
GNK | 2021-08-26 | 2.1 | 1.1 | -15.6 | -30.4 |
GNK | 2021-08-25 | 2.1 | 1.0 | -15.3 | -30.0 |
GNK | 2021-08-24 | 2.0 | 1.0 | -14.9 | -29.3 |
GNK | 2021-08-23 | 1.9 | 1.0 | -14.2 | -28.2 |
GNK | 2021-08-20 | 1.8 | 0.9 | -13.6 | -27.2 |
GNK | 2021-08-19 | 1.8 | 0.9 | -13.3 | -26.9 |
GNK Growth Metrics
- The year over year revenue growth rate now stands at -12.57%.
- Its 2 year cash and equivalents growth rate is now at -16.29%.
- The 3 year price growth rate now stands at 45.17%.

The table below shows GNK's growth in key financial areas (numbers in millions of US dollars).
Date | Revenue | Operating Cash Flow | Net Income to Common Stock |
---|---|---|---|
2021-12-31 | 547.129 | 231.119 | 182.007 |
2021-09-30 | 459.345 | 155.868 | 25.233 |
2021-06-30 | 391.617 | 108.425 | -52.997 |
2021-03-31 | 344.815 | 54.428 | -103.238 |
2020-12-31 | 355.56 | 36.896 | -225.573 |
2020-09-30 | 368.772 | 46.783 | -158.769 |
GNK's Quality Factors
The “Quality” component of the POWR Ratings focuses on 31 different factors of a companies fundamentals and operational strength. Here are some key insights as we drill into the specifics of these quality attributes.- GNK has a Quality Grade of C, ranking ahead of 69.27% of graded US stocks.
- GNK's asset turnover comes in at 0.385 -- ranking 51st of 137 Transportation stocks.
- ECHO, USDP, and AIRT are the stocks whose asset turnover ratios are most correlated with GNK.
The table below shows GNK's key quality metrics over time.
Period | Asset Turnover | Gross Margin | ROIC |
---|---|---|---|
2021-09-30 | 0.385 | 0.454 | 0.032 |
2021-06-30 | 0.319 | 0.386 | -0.025 |
2021-03-31 | 0.271 | 0.301 | -0.057 |
2020-12-31 | 0.269 | 0.284 | -0.133 |
2020-09-30 | 0.264 | 0.273 | -0.083 |
2020-06-30 | 0.264 | 0.264 | -0.074 |
GNK Price Target
For more insight on analysts targets of GNK, see our GNK price target page. And for a list of of all stocks sorted by upside potential based on analyst target price, see our Top Price Target page.
Average Price Target | $25.23 | Average Broker Recommendation | 1.4 (Strong Buy) |
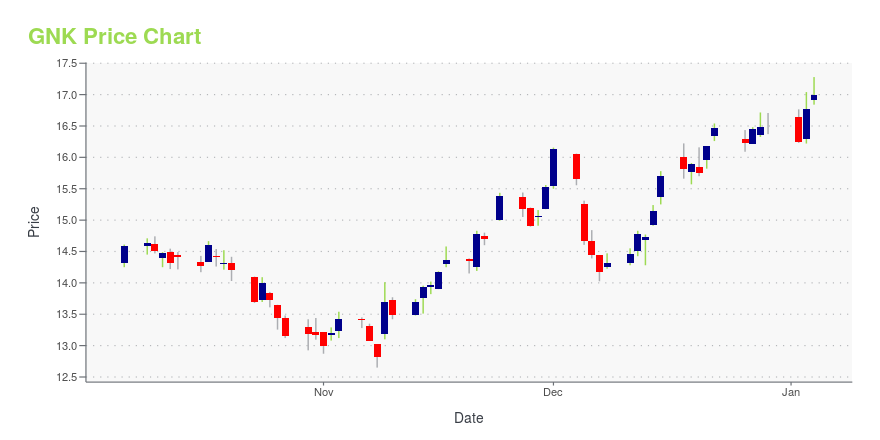
GNK Stock Price Chart Interactive Chart >
GNK Price/Volume Stats
Current price | $21.82 | 52-week high | $26.00 |
Prev. close | $21.95 | 52-week low | $13.21 |
Day low | $21.68 | Volume | 908,267 |
Day high | $22.66 | Avg. volume | 1,028,746 |
50-day MA | $22.23 | Dividend yield | 14.4% |
200-day MA | $18.52 | Market Cap | 918.67M |
Genco Shipping & Trading Ltd. (GNK) Company Bio
Genco Shipping & Trading transports iron ore, coal, grain, steel products and other drybulk cargoes along worldwide shipping routes. The company was founded in 2004 and is based in New York, New York.
Latest GNK News From Around the Web
Below are the latest news stories about Genco Shipping & Trading Ltd that investors may wish to consider to help them evaluate GNK as an investment opportunity.
Genco Shipping & Trading Limited 2021 Q4 - Results - Earnings Call PresentationThe following slide deck was published by Genco Shipping & Trading Limited in conjunction with their 2021 Q4 earnings call.... |
Genco Shipping & Trading (GNK) CEO John Wobensmith on Q4 2021 Results - Earnings Call TranscriptGenco Shipping & Trading, Ltd. (GNK) Q4 2021 Earnings Conference Call February 24, 2022 08:30 AM ET Company Participants Peter Allen - SVP, S&F John Wobensmith - CEO Apostolos Zafolias - CFO Conference Call Participants Randy Giveans - Jefferies Magnus Fyhr - HC Wainwright Greg Lewis - BTIG Liam Burke... |
Genco Shipping Non-GAAP EPS of $1.99 beats by $0.05, revenue of $183.28M beats by $49.32MGenco Shipping press release (GNK): Q4 Non-GAAP EPS of $1.99 beats by $0.05.Revenue of $183.28M (+91.9% Y/Y) beats by $49.32M.CEO comment: "Looking ahead to the first quarter of… |
Genco Shipping & Trading (GNK) Q4 Earnings and Revenues Top EstimatesGenco Shipping (GNK) delivered earnings and revenue surprises of 5.29% and 13.45%, respectively, for the quarter ended December 2021. Do the numbers hold clues to what lies ahead for the stock? |
Genco Shipping & Trading Limited Announces Fourth Quarter Financial ResultsValue Strategy Implemented; Declares Dividend of $0.67 per share for Fourth Quarter 2021 Reports Highest Quarterly Earnings Per Share Since 2008 NEW YORK, Feb. 24, 2022 (GLOBE NEWSWIRE) -- Genco Shipping & Trading Limited (NYSE:GNK) (“Genco” or the “Company”), the largest U.S. headquartered drybulk shipowner focused on the global transportation of commodities, today reported its financial results for the three months and twelve months ended December 31, 2021. The following financial review discu |
GNK Price Returns
1-mo | N/A |
3-mo | 28.16% |
6-mo | 65.88% |
1-year | 54.29% |
3-year | 218.83% |
5-year | 163.42% |
YTD | 46.19% |
2021 | 121.79% |
2020 | -28.23% |
2019 | 41.19% |
2018 | -40.77% |
2017 | 80.49% |
GNK Dividends
Ex-Dividend Date | Type | Payout Amount | Change | ||||||
---|---|---|---|---|---|---|---|---|---|
Loading, please wait... |
Continue Researching GNK
Want to do more research on Genco Shipping & Trading Ltd's stock and its price? Try the links below:Genco Shipping & Trading Ltd (GNK) Stock Price | Nasdaq
Genco Shipping & Trading Ltd (GNK) Stock Quote, History and News - Yahoo Finance
Genco Shipping & Trading Ltd (GNK) Stock Price and Basic Information | MarketWatch
Loading social stream, please wait...