Golden Ocean Group Limited (GOGL): Price and Financial Metrics
GOGL Price/Volume Stats
Current price | $7.88 | 52-week high | $10.58 |
Prev. close | $7.90 | 52-week low | $6.89 |
Day low | $7.86 | Volume | 1,072,800 |
Day high | $7.98 | Avg. volume | 1,543,770 |
50-day MA | $7.50 | Dividend yield | 5.04% |
200-day MA | $8.46 | Market Cap | 1.58B |
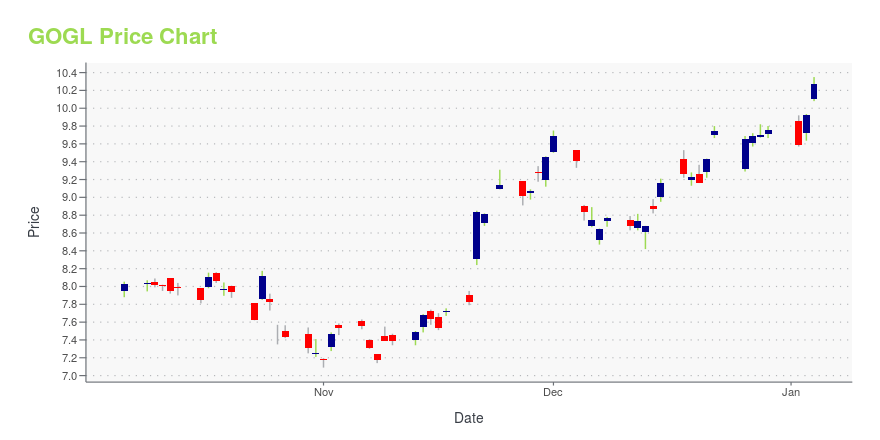
GOGL Stock Price Chart Interactive Chart >
GOGL POWR Grades
- GOGL scores best on the Momentum dimension, with a Momentum rank ahead of 78.68% of US stocks.
- The strongest trend for GOGL is in Quality, which has been heading down over the past 177 days.
- GOGL's current lowest rank is in the Growth metric (where it is better than 1.12% of US stocks).
GOGL Stock Summary
- Of note is the ratio of GOLDEN OCEAN GROUP LTD's sales and general administrative expense to its total operating expenses; just 4.86% of US stocks have a lower such ratio.
- For GOGL, its debt to operating expenses ratio is greater than that reported by 93.02% of US equities we're observing.
- Revenue growth over the past 12 months for GOLDEN OCEAN GROUP LTD comes in at -30.33%, a number that bests merely 8.66% of the US stocks we're tracking.
- Stocks that are quantitatively similar to GOGL, based on their financial statements, market capitalization, and price volatility, are LAND, DHC, UNIT, AQN, and CWEN.
- Visit GOGL's SEC page to see the company's official filings. To visit the company's web site, go to www.goldenocean.bm.
GOGL Valuation Summary
- In comparison to the median Industrials stock, GOGL's EV/EBIT ratio is 34.39% lower, now standing at 10.3.
- Over the past 243 months, GOGL's price/sales ratio has gone down 2.3.
Below are key valuation metrics over time for GOGL.
Stock | Date | P/S | P/B | P/E | EV/EBIT |
---|---|---|---|---|---|
GOGL | 2023-09-19 | 1.6 | 0.8 | 7.7 | 10.3 |
GOGL | 2023-09-18 | 1.6 | 0.8 | 7.6 | 10.3 |
GOGL | 2023-09-15 | 1.6 | 0.8 | 7.7 | 10.3 |
GOGL | 2023-09-14 | 1.6 | 0.8 | 7.7 | 10.4 |
GOGL | 2023-09-13 | 1.6 | 0.8 | 7.5 | 10.2 |
GOGL | 2023-09-12 | 1.6 | 0.8 | 7.4 | 10.2 |
GOGL Growth Metrics
- Its 2 year cash and equivalents growth rate is now at -9.91%.
- Its year over year cash and equivalents growth rate is now at -64.78%.
- The 3 year cash and equivalents growth rate now stands at -41.89%.

The table below shows GOGL's growth in key financial areas (numbers in millions of US dollars).
Date | Revenue | Operating Cash Flow | Net Income to Common Stock |
---|---|---|---|
2022-09-30 | 1,245.706 | 596.937 | 597.455 |
2022-06-30 | 1,351.275 | 698.741 | 688.219 |
2022-03-31 | 1,310.312 | 677.444 | 628.965 |
2021-12-31 | 1,203.181 | 560.398 | 527.218 |
2021-12-31 | 1,203.181 | 560.398 | 527.218 |
2021-09-30 | 990.081 | 412.598 | 348.773 |
GOGL's Quality Factors
The “Quality” component of the POWR Ratings focuses on 31 different factors of a companies fundamentals and operational strength. Here are some key insights as we drill into the specifics of these quality attributes.- GOGL has a Quality Grade of D, ranking ahead of 16.6% of graded US stocks.
- GOGL's asset turnover comes in at 0.265 -- ranking 76th of 137 Transportation stocks.
- DSKE, HTLD, and DAC are the stocks whose asset turnover ratios are most correlated with GOGL.
The table below shows GOGL's key quality metrics over time.
Period | Asset Turnover | Gross Margin | ROIC |
---|---|---|---|
2021-06-30 | 0.265 | 0.412 | 0.060 |
2021-06-30 | 0.265 | 0.412 | 0.060 |
2021-03-31 | 0.226 | 0.329 | 0.025 |
2020-12-31 | 0.222 | 0.256 | -0.026 |
2020-12-31 | 0.222 | 0.256 | -0.026 |
2020-09-30 | 0.244 | 0.252 | -0.020 |
GOGL Price Target
For more insight on analysts targets of GOGL, see our GOGL price target page. And for a list of of all stocks sorted by upside potential based on analyst target price, see our Top Price Target page.
Average Price Target | $11.29 | Average Broker Recommendation | 1.44 (Moderate Buy) |
Golden Ocean Group Limited (GOGL) Company Bio
Golden Ocean Group Limited engages in the transportation of dry bulk cargoes in the Capesize and Panamax markets. The company transports ores, coal, grains, and fertilizers along worldwide shipping routes. The company was founded in 2004 and is based in Hamilton, Bermuda.
Latest GOGL News From Around the Web
Below are the latest news stories about GOLDEN OCEAN GROUP LTD that investors may wish to consider to help them evaluate GOGL as an investment opportunity.
Company News for Aug 30, 2023Companies in The News Are: BBY,SJM,GOGL,BNS |
Golden Ocean Group Limited (NASDAQ:GOGL) Q2 2023 Earnings Call TranscriptGolden Ocean Group Limited (NASDAQ:GOGL) Q2 2023 Earnings Call Transcript August 29, 2023 Operator: Good day, and thank you for standing by. Welcome to the Second Quarter 2023 Golden Ocean Group Limited Earnings Conference Call. [Operator Instructions] Please be advised today’s conference is being recorded. I would now like to hand the conference over to […] |
GOGL – Q2 2023 PresentationPlease find enclosed the presentation of Golden Ocean Group Limited’s second quarter 2023 results for today’s webcast / conference call at 15:00 CEST. Attend by Webcast: Use the follow link prior to the webcast: GOGL Q2 2023 Webcast Attend by Conference Call: Participants will need to register online prior to the conference call via the link below. Dial-in details will be available when registered. GOGL Q2 2023 Conference Call A Q&A session will be held after the conference call/webcast. Informa |
Golden Ocean Group (GOGL) Q2 Earnings and Revenues Beat EstimatesGolden Ocean Group (GOGL) delivered earnings and revenue surprises of 44.44% and 9.29%, respectively, for the quarter ended June 2023. Do the numbers hold clues to what lies ahead for the stock? |
GOGL – Second Quarter 2023 ResultsGolden Ocean Group Limited (NASDAQ/OSE: GOGL) (the “Company” or “Golden Ocean”), the world's largest listed owner of large size dry bulk vessels, today announced its unaudited results for the quarter ended June 30, 2023. Highlights Net income of $34.9 million and earnings per share of $0.17 (basic) for the second quarter of 2023. This compares with a net loss of $8.8 million and loss per share of $0.04 (basic) for the first quarter of 2023.Adjusted EBITDA of $80.4 million for the second quarter |
GOGL Price Returns
1-mo | 9.26% |
3-mo | 5.78% |
6-mo | -11.77% |
1-year | 15.07% |
3-year | 212.80% |
5-year | 32.50% |
YTD | -5.06% |
2022 | 15.44% |
2021 | 135.46% |
2020 | -19.32% |
2019 | -0.16% |
2018 | -20.17% |
GOGL Dividends
Ex-Dividend Date | Type | Payout Amount | Change | ||||||
---|---|---|---|---|---|---|---|---|---|
Loading, please wait... |
Continue Researching GOGL
Here are a few links from around the web to help you further your research on Golden Ocean Group Ltd's stock as an investment opportunity:Golden Ocean Group Ltd (GOGL) Stock Price | Nasdaq
Golden Ocean Group Ltd (GOGL) Stock Quote, History and News - Yahoo Finance
Golden Ocean Group Ltd (GOGL) Stock Price and Basic Information | MarketWatch
Loading social stream, please wait...