
Goldman Sachs Group Inc. (GS): Price and Financial Metrics
GS Price/Volume Stats
| Current price | $703.56 | 52-week high | $726.00 |
| Prev. close | $706.00 | 52-week low | $437.37 |
| Day low | $691.88 | Volume | 1,010,311 |
| Day high | $706.49 | Avg. volume | 2,648,251 |
| 50-day MA | $647.29 | Dividend yield | 1.69% |
| 200-day MA | $0.00 | Market Cap | 215.88B |
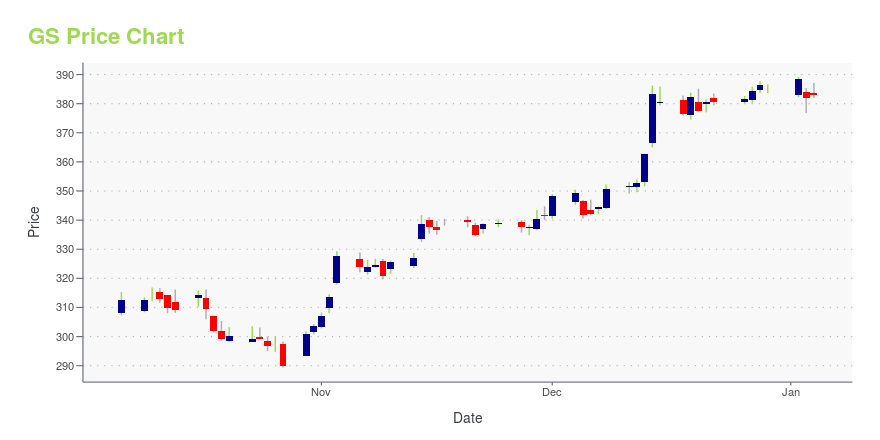
GS Stock Price Chart Interactive Chart >
Goldman Sachs Group Inc. (GS) Company Bio
Goldman Sachs operates as an investment banking, securities, and investment management company worldwide. The company operates through four segments: Investment Banking, Institutional Client Services, Investing & Lending, and Investment Management. The company was founded in 1869 and is based in New York, New York.
GS Price Returns
| 1-mo | 9.79% |
| 3-mo | 33.58% |
| 6-mo | 11.11% |
| 1-year | 47.49% |
| 3-year | 135.08% |
| 5-year | 290.72% |
| YTD | 24.09% |
| 2024 | 52.03% |
| 2023 | 15.91% |
| 2022 | -7.87% |
| 2021 | 47.61% |
| 2020 | 17.45% |
GS Dividends
| Ex-Dividend Date | Type | Payout Amount | Change | ||||||
|---|---|---|---|---|---|---|---|---|---|
| Loading, please wait... | |||||||||
Continue Researching GS
Want to do more research on Goldman Sachs Group Inc's stock and its price? Try the links below:Goldman Sachs Group Inc (GS) Stock Price | Nasdaq
Goldman Sachs Group Inc (GS) Stock Quote, History and News - Yahoo Finance
Goldman Sachs Group Inc (GS) Stock Price and Basic Information | MarketWatch
Loading social stream, please wait...