
Getty Realty Corporation (GTY): Price and Financial Metrics
GTY Price/Volume Stats
| Current price | $31.68 | 52-week high | $34.38 |
| Prev. close | $31.77 | 52-week low | $25.70 |
| Day low | $31.31 | Volume | 317,989 |
| Day high | $32.19 | Avg. volume | 269,538 |
| 50-day MA | $27.88 | Dividend yield | 5.76% |
| 200-day MA | $27.80 | Market Cap | 1.71B |
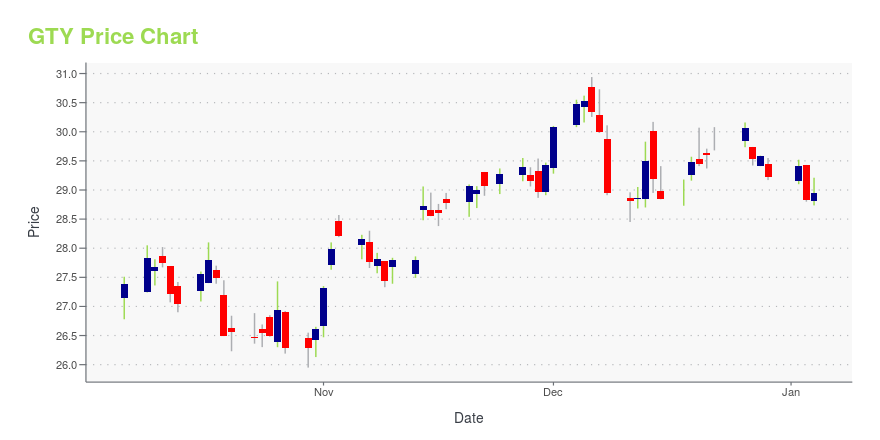
GTY Stock Price Chart Interactive Chart >
Getty Realty Corporation (GTY) Company Bio
Getty Realty Corporation specializes in the ownership, leasing and financing of convenience store/gas station properties. The company was founded in 1955 and is based in Jericho, New York.
Latest GTY News From Around the Web
Below are the latest news stories about GETTY REALTY CORP that investors may wish to consider to help them evaluate GTY as an investment opportunity.
Getty Realty Corp. to Report Fourth Quarter 2023 Financial ResultsNEW YORK, December 27, 2023--Getty Realty Corp. (NYSE: GTY) will release its financial results for the fourth quarter ended December 31, 2023, after the market closes on Wednesday, February 14, 2024. |
Getty Realty Corp. Announces 2023 Getty Gives ActivityNEW YORK, December 22, 2023--As part of its ongoing commitment to effective environmental, social and governance ("ESG") practices, Getty Realty Corp. (NYSE: GTY) today announced the results of its 2023 Getty Gives campaign. |
3 REITs That Recently Announced Dividend Increases After Beating EstimatesInvestors love dividend increases for two reasons. The first is obvious: Dividend increases put more money in their pockets in future quarters. The second is that dividend increases are the company's way of expressing confidence in its ability to continue maintaining or growing earnings going forward. But the icing on the cake for investors is when a company simultaneously announces earnings that beat analyst estimates and a dividend increase. Take a look at three real estate investment trusts ( |
The Getty Realty Corp (GTY) Company: A Short SWOT AnalysisUnveiling Strengths, Weaknesses, Opportunities, and Threats in the Midst of a Competitive Real Estate Market |
Getty Realty Corp. (NYSE:GTY) Q3 2023 Earnings Call TranscriptGetty Realty Corp. (NYSE:GTY) Q3 2023 Earnings Call Transcript October 26, 2023 Operator: Good morning, and welcome to Getty Realty’s Earnings Conference Call for the Third Quarter 2023. This call is being recorded. After the presentation, there will be an opportunity to ask questions. Prior to the starting of the call, Joshua Dicker, Executive Vice […] |
GTY Price Returns
| 1-mo | 22.89% |
| 3-mo | 19.74% |
| 6-mo | 18.01% |
| 1-year | 3.31% |
| 3-year | 16.95% |
| 5-year | 38.86% |
| YTD | 12.19% |
| 2023 | -8.76% |
| 2022 | 11.68% |
| 2021 | 22.75% |
| 2020 | -11.32% |
| 2019 | 16.81% |
GTY Dividends
| Ex-Dividend Date | Type | Payout Amount | Change | ||||||
|---|---|---|---|---|---|---|---|---|---|
| Loading, please wait... | |||||||||
Continue Researching GTY
Want to see what other sources are saying about Getty Realty Corp's financials and stock price? Try the links below:Getty Realty Corp (GTY) Stock Price | Nasdaq
Getty Realty Corp (GTY) Stock Quote, History and News - Yahoo Finance
Getty Realty Corp (GTY) Stock Price and Basic Information | MarketWatch
Loading social stream, please wait...