Guidewire Software, Inc. (GWRE): Price and Financial Metrics
GWRE Price/Volume Stats
Current price | $88.21 | 52-week high | $95.88 |
Prev. close | $91.25 | 52-week low | $52.08 |
Day low | $88.14 | Volume | 633,700 |
Day high | $90.85 | Avg. volume | 718,340 |
50-day MA | $83.88 | Dividend yield | N/A |
200-day MA | $75.76 | Market Cap | 7.18B |
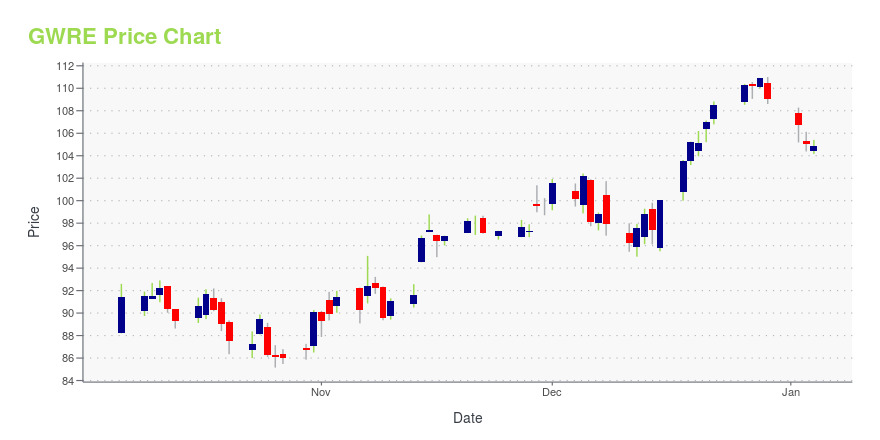
GWRE Stock Price Chart Interactive Chart >
GWRE POWR Grades
- Growth is the dimension where GWRE ranks best; there it ranks ahead of 82.3% of US stocks.
- GWRE's strongest trending metric is Momentum; it's been moving up over the last 179 days.
- GWRE ranks lowest in Value; there it ranks in the 21st percentile.
GWRE Stock Summary
- GWRE's one year PEG ratio, measuring expected growth in earnings next year relative to current common stock price is 172.08 -- higher than 83.89% of US-listed equities with positive expected earnings growth.
- The price/operating cash flow metric for GUIDEWIRE SOFTWARE INC is higher than 98.78% of stocks in our set with a positive cash flow.
- GWRE's price/sales ratio is 8.38; that's higher than the P/S ratio of 87.56% of US stocks.
- If you're looking for stocks that are quantitatively similar to GUIDEWIRE SOFTWARE INC, a group of peers worth examining would be EB, FROG, OLO, SEDG, and MANH.
- Visit GWRE's SEC page to see the company's official filings. To visit the company's web site, go to www.guidewire.com.
GWRE Valuation Summary
- GWRE's price/sales ratio is 8.5; this is 240% higher than that of the median Technology stock.
- GWRE's price/sales ratio has moved up 4.2 over the prior 142 months.
Below are key valuation metrics over time for GWRE.
Stock | Date | P/S | P/B | P/E | EV/EBIT |
---|---|---|---|---|---|
GWRE | 2023-09-15 | 8.5 | 6.2 | -48.1 | -43.2 |
GWRE | 2023-09-14 | 8.4 | 6.2 | -47.8 | -43.0 |
GWRE | 2023-09-13 | 8.5 | 6.3 | -48.3 | -43.4 |
GWRE | 2023-09-12 | 8.6 | 6.3 | -48.6 | -43.7 |
GWRE | 2023-09-11 | 8.6 | 6.3 | -48.8 | -43.8 |
GWRE | 2023-09-08 | 8.7 | 6.4 | -49.4 | -44.4 |
GWRE Growth Metrics
- Its year over year revenue growth rate is now at 5.27%.
- The year over year net income to common stockholders growth rate now stands at -463.42%.
- The 4 year price growth rate now stands at 52.23%.

The table below shows GWRE's growth in key financial areas (numbers in millions of US dollars).
Date | Revenue | Operating Cash Flow | Net Income to Common Stock |
---|---|---|---|
2022-09-30 | 841.962 | -18.333 | -198.473 |
2022-06-30 | 812.614 | -37.94 | -180.431 |
2022-03-31 | 797.45 | -13.178 | -150.433 |
2021-12-31 | 763.97 | 3.913 | -129.622 |
2021-09-30 | 739.399 | 20.252 | -97.593 |
2021-06-30 | 743.267 | 111.587 | -66.507 |
GWRE's Quality Factors
The “Quality” component of the POWR Ratings focuses on 31 different factors of a companies fundamentals and operational strength. Here are some key insights as we drill into the specifics of these quality attributes.- GWRE has a Quality Grade of C, ranking ahead of 48.64% of graded US stocks.
- GWRE's asset turnover comes in at 0.322 -- ranking 421st of 561 Business Services stocks.
- ROL, ENV, and BBSI are the stocks whose asset turnover ratios are most correlated with GWRE.
The table below shows GWRE's key quality metrics over time.
Period | Asset Turnover | Gross Margin | ROIC |
---|---|---|---|
2021-07-31 | 0.322 | 0.495 | -0.046 |
2021-04-30 | 0.326 | 0.521 | -0.016 |
2021-01-31 | 0.329 | 0.532 | -0.012 |
2020-10-31 | 0.331 | 0.539 | -0.008 |
2020-07-31 | 0.330 | 0.545 | -0.003 |
2020-04-30 | 0.321 | 0.529 | -0.018 |
Guidewire Software, Inc. (GWRE) Company Bio
Guidewire Software provides software products for property and casualty (P&C) insurers. It offers an integrated suite of software applications that address the core processes, such as underwriting and policy administration, claims management, and billing. The company was founded in 2001 and is based in Foster City, California.
Latest GWRE News From Around the Web
Below are the latest news stories about GUIDEWIRE SOFTWARE INC that investors may wish to consider to help them evaluate GWRE as an investment opportunity.
Wawanesa Deploys Guidewire Cloud to Drive Service, Innovation, and GrowthWINNIPEG, Manitoba & SAN MATEO, Calif., September 18, 2023--Wawanesa has successfully deployed Guidewire Cloud to drive service, innovation, and growth. |
Guidewire Awards Latest Group of PartnerConnect Consulting Program SpecializationsSAN MATEO, Calif., September 14, 2023--Guidewire (NYSE: GWRE) announced that 19 specializations have been awarded to 10 Guidewire PartnerConnect Consulting partners. |
Automate Auto Glass Claims with Belron Canada’s New Guidewire Marketplace AppSAN MATEO, Calif. & MONTREAL, September 12, 2023--Guidewire and Belron Canada announced that Belron Canada’s new app is now available to Claim Center users in the Guidewire Marketplace. |
Hollard Deploys Guidewire ClaimCenter on Guidewire Cloud for Seamless Omnichannel Claims ExperienceSYDNEY & SAN MATEO, Calif., September 11, 2023--Hollard has implemented Guidewire ClaimCenter on Guidewire Cloud to power its claims management system |
Kroger, Apple, Planet Labs, Smartsheet, RH, Snowflake, and More of Today’s Stock Market MoversKroger recorded a $1.4 billion charge in its second quarter to settle opioid claims, Apple stock rose after two days of steep losses, Planet Labs reduced revenue guidance, and Smartsheet surged following better-than-expected earnings. |
GWRE Price Returns
1-mo | 9.46% |
3-mo | 25.16% |
6-mo | 14.41% |
1-year | 48.33% |
3-year | -17.26% |
5-year | -10.63% |
YTD | 41.00% |
2022 | -44.90% |
2021 | -11.81% |
2020 | 17.27% |
2019 | 36.82% |
2018 | 8.04% |
Continue Researching GWRE
Want to see what other sources are saying about Guidewire Software Inc's financials and stock price? Try the links below:Guidewire Software Inc (GWRE) Stock Price | Nasdaq
Guidewire Software Inc (GWRE) Stock Quote, History and News - Yahoo Finance
Guidewire Software Inc (GWRE) Stock Price and Basic Information | MarketWatch
Loading social stream, please wait...