
Hanmi Financial Corporation (HAFC): Price and Financial Metrics
HAFC Price/Volume Stats
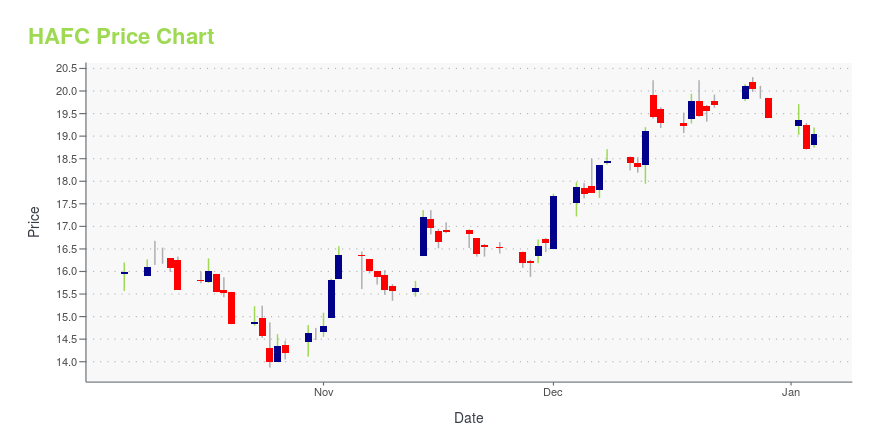
| Current price | $20.51 | 52-week high | $20.90 |
| Prev. close | $20.10 | 52-week low | $13.87 |
| Day low | $20.13 | Volume | 318,722 |
| Day high | $20.70 | Avg. volume | 248,005 |
| 50-day MA | $16.65 | Dividend yield | 4.83% |
| 200-day MA | $16.43 | Market Cap | 623.24M |
HAFC Stock Price Chart Interactive Chart >
Hanmi Financial Corporation (HAFC) Company Bio
Hanmi Financial Corporation provides business banking products and services in California, Texas, Illinois, Virginia, New Jersey, New York, Colorado, Washington, and Georgia. The company was founded in 1981 and is based in Los Angeles, California.
Latest HAFC News From Around the Web
Below are the latest news stories about HANMI FINANCIAL CORP that investors may wish to consider to help them evaluate HAFC as an investment opportunity.
Hanmi Financial (NASDAQ:HAFC) Has Announced A Dividend Of $0.25Hanmi Financial Corporation's ( NASDAQ:HAFC ) investors are due to receive a payment of $0.25 per share on 22nd of... |
Hanmi Financial Declares Cash Dividend of $0.25 per shareLOS ANGELES, Oct. 26, 2023 (GLOBE NEWSWIRE) -- Hanmi Financial Corporation (NASDAQ: HAFC, or “Hanmi”), the parent company of Hanmi Bank (the “Bank”), today announced that its Board of Directors declared a cash dividend on its common stock for the 2023 fourth quarter of $0.25 per share. The dividend will be paid on November 22, 2023, to stockholders of record as of the close of business on November 6, 2023. About Hanmi Financial Corporation Headquartered in Los Angeles, California, Hanmi Financia |
Hanmi Financial Corporation (NASDAQ:HAFC) Q3 2023 Earnings Call TranscriptHanmi Financial Corporation (NASDAQ:HAFC) Q3 2023 Earnings Call Transcript October 24, 2023 Hanmi Financial Corporation beats earnings expectations. Reported EPS is $0.62, expectations were $0.61. Operator: Ladies and gentlemen, welcome to the Hanmi Financial Corporation’s Third Quarter 2023 Conference Call. As a reminder, today’s call is being recorded for replay purposes. [Operator Instructions] I would […] |
Hanmi Financial (HAFC) Loses -10.44% in 4 Weeks, Here's Why a Trend Reversal May be Around the CornerHanmi Financial (HAFC) has become technically an oversold stock now, which implies exhaustion of the heavy selling pressure on it. This, combined with strong agreement among Wall Street analysts in revising earnings estimates higher, indicates a potential trend reversal for the stock in the near term. |
Compared to Estimates, Hanmi Financial (HAFC) Q3 Earnings: A Look at Key MetricsWhile the top- and bottom-line numbers for Hanmi Financial (HAFC) give a sense of how the business performed in the quarter ended September 2023, it could be worth looking at how some of its key metrics compare to Wall Street estimates and year-ago values. |
HAFC Price Returns
| 1-mo | 28.83% |
| 3-mo | 31.72% |
| 6-mo | 24.32% |
| 1-year | 16.81% |
| 3-year | 35.19% |
| 5-year | 18.57% |
| YTD | 9.07% |
| 2023 | -16.97% |
| 2022 | 8.49% |
| 2021 | 114.65% |
| 2020 | -40.77% |
| 2019 | 6.23% |
HAFC Dividends
| Ex-Dividend Date | Type | Payout Amount | Change | ||||||
|---|---|---|---|---|---|---|---|---|---|
| Loading, please wait... | |||||||||
Continue Researching HAFC
Here are a few links from around the web to help you further your research on Hanmi Financial Corp's stock as an investment opportunity:Hanmi Financial Corp (HAFC) Stock Price | Nasdaq
Hanmi Financial Corp (HAFC) Stock Quote, History and News - Yahoo Finance
Hanmi Financial Corp (HAFC) Stock Price and Basic Information | MarketWatch
Loading social stream, please wait...