
Hasbro Inc. (HAS): Price and Financial Metrics
HAS Price/Volume Stats
| Current price | $77.19 | 52-week high | $78.83 |
| Prev. close | $75.92 | 52-week low | $49.00 |
| Day low | $76.05 | Volume | 1,990,200 |
| Day high | $77.93 | Avg. volume | 1,996,089 |
| 50-day MA | $69.52 | Dividend yield | 3.74% |
| 200-day MA | $0.00 | Market Cap | 10.82B |
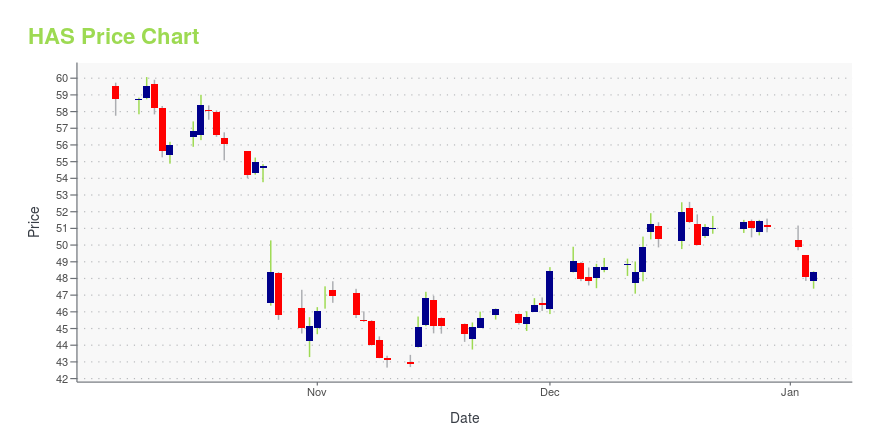
HAS Stock Price Chart Interactive Chart >
Hasbro Inc. (HAS) Company Bio
Hasbro, Inc. (/ˈhæzbroʊ/; a syllabic abbreviation of its original name, Hassenfeld Brothers) is an American multinational conglomerate holding company incorporated and headquartered in Pawtucket, Rhode Island. Hasbro owns the trademarks and products of Kenner, Milton Bradley, Parker Brothers, and Wizards of the Coast, among others. As of August 2020 over 81.5% of its shares were held by large financial institutions. (Source:Wikipedia)
HAS Price Returns
| 1-mo | 14.36% |
| 3-mo | N/A |
| 6-mo | 37.49% |
| 1-year | 32.84% |
| 3-year | 11.61% |
| 5-year | 21.57% |
| YTD | 41.01% |
| 2024 | 14.76% |
| 2023 | -11.95% |
| 2022 | -37.93% |
| 2021 | 11.90% |
| 2020 | -8.42% |
HAS Dividends
| Ex-Dividend Date | Type | Payout Amount | Change | ||||||
|---|---|---|---|---|---|---|---|---|---|
| Loading, please wait... | |||||||||
Continue Researching HAS
Want to see what other sources are saying about Hasbro Inc's financials and stock price? Try the links below:Hasbro Inc (HAS) Stock Price | Nasdaq
Hasbro Inc (HAS) Stock Quote, History and News - Yahoo Finance
Hasbro Inc (HAS) Stock Price and Basic Information | MarketWatch
Loading social stream, please wait...