
Huntington Bancshares Inc. (HBAN): Price and Financial Metrics
HBAN Price/Volume Stats
| Current price | $15.13 | 52-week high | $15.24 |
| Prev. close | $15.06 | 52-week low | $9.25 |
| Day low | $14.96 | Volume | 17,412,300 |
| Day high | $15.18 | Avg. volume | 17,534,426 |
| 50-day MA | $13.51 | Dividend yield | 4.11% |
| 200-day MA | $12.65 | Market Cap | 21.93B |
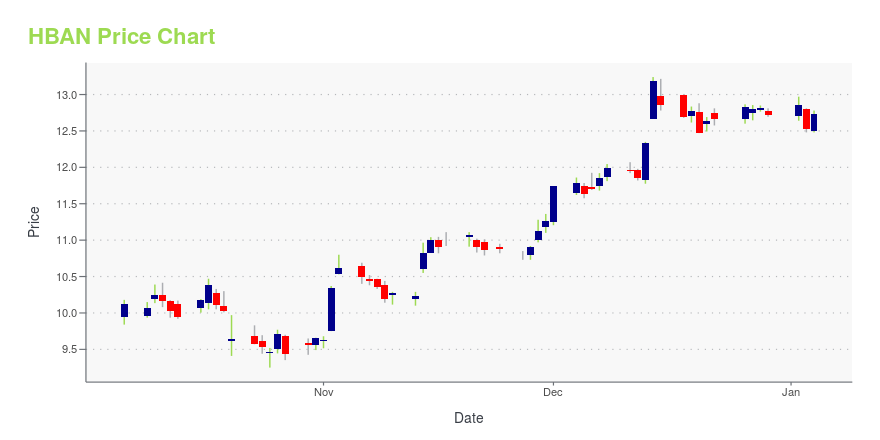
HBAN Stock Price Chart Interactive Chart >
Huntington Bancshares Inc. (HBAN) Company Bio
Huntington Bancshares Incorporated is an American bank holding company headquartered in Columbus, Ohio. The company is ranked 521st on the Fortune 500, and is 26th on the list of largest banks in the United States. (Source:Wikipedia)
Latest HBAN News From Around the Web
Below are the latest news stories about HUNTINGTON BANCSHARES INC that investors may wish to consider to help them evaluate HBAN as an investment opportunity.
Huntington (HBAN) Undertakes Actions to Improve Q4 CET RatioHuntington (HBAN) completes a synthetic CRT transaction related to a $3-billion portfolio of prime indirect auto loans to boost CET 1 capital and terminates its pay-fixed swaption program. |
13 Best Low-Priced Dividend Stocks To Invest InIn this article, we will take a detailed look at the 13 Best Low-Priced Dividend Stocks To Invest In. For a quick overview of such stocks, read our article 5 Best Low-Priced Dividend Stocks To Invest In. Stocks rebounded sharply in 2023 despite recession clouds and macro uncertainty. This development did not bode well for dividend investors who were bracing […] |
13 Best Holding Company Stocks To Invest InIn this article, we discuss the 13 best holding company stocks to invest in. If you want to skip our detailed analysis of these stocks, go directly to 5 Best Holding Company Stocks To Invest In. The incredible financial stability offered by the post-World War international order has allowed business to thrive across the world, […] |
Huntington Bancshares Inc's Dividend AnalysisHuntington Bancshares Inc (NASDAQ:HBAN) recently announced a dividend of $0.16 per share, payable on 2024-01-02, with the ex-dividend date set for 2023-12-15. As investors look forward to this upcoming payment, the spotlight also shines on the company's dividend history, yield, and growth rates. Using the data from GuruFocus, let's look into Huntington Bancshares Inc's dividend performance and assess its sustainability. |
Huntington Bancshares (HBAN) Moves 6.9% Higher: Will This Strength Last?Huntington Bancshares (HBAN) saw its shares surge in the last session with trading volume being higher than average. The latest trend in earnings estimate revisions could translate into further price increase in the near term. |
HBAN Price Returns
| 1-mo | 19.04% |
| 3-mo | 13.08% |
| 6-mo | 18.82% |
| 1-year | 32.65% |
| 3-year | 25.62% |
| 5-year | 32.17% |
| YTD | 21.90% |
| 2023 | -4.72% |
| 2022 | -4.37% |
| 2021 | 27.05% |
| 2020 | -11.06% |
| 2019 | 31.74% |
HBAN Dividends
| Ex-Dividend Date | Type | Payout Amount | Change | ||||||
|---|---|---|---|---|---|---|---|---|---|
| Loading, please wait... | |||||||||
Continue Researching HBAN
Here are a few links from around the web to help you further your research on Huntington Bancshares Inc's stock as an investment opportunity:Huntington Bancshares Inc (HBAN) Stock Price | Nasdaq
Huntington Bancshares Inc (HBAN) Stock Quote, History and News - Yahoo Finance
Huntington Bancshares Inc (HBAN) Stock Price and Basic Information | MarketWatch
Loading social stream, please wait...