Heico Corp. (HEI): Price and Financial Metrics
HEI Price/Volume Stats
Current price | $191.00 | 52-week high | $200.64 |
Prev. close | $194.43 | 52-week low | $153.63 |
Day low | $190.72 | Volume | 431,600 |
Day high | $195.99 | Avg. volume | 382,567 |
50-day MA | $188.41 | Dividend yield | 0.11% |
200-day MA | $174.51 | Market Cap | 26.43B |
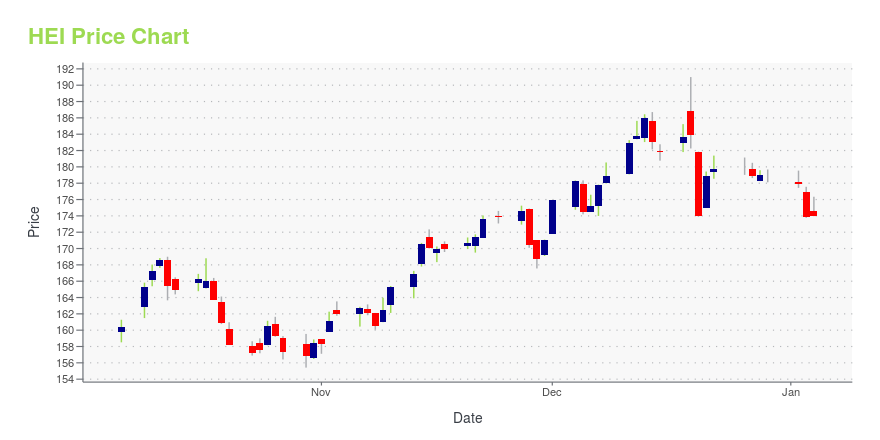
HEI Stock Price Chart Interactive Chart >
HEI POWR Grades
- Momentum is the dimension where HEI ranks best; there it ranks ahead of 81.12% of US stocks.
- HEI's strongest trending metric is Growth; it's been moving down over the last 26 weeks.
- HEI's current lowest rank is in the Value metric (where it is better than 5.41% of US stocks).
HEI Stock Summary
- Price to trailing twelve month operating cash flow for HEI is currently 53.57, higher than 93.83% of US stocks with positive operating cash flow.
- With a year-over-year growth in debt of 753.7%, HEICO CORP's debt growth rate surpasses 98.78% of about US stocks.
- In terms of volatility of its share price, HEI is more volatile than merely 2.21% of stocks we're observing.
- Stocks that are quantitatively similar to HEI, based on their financial statements, market capitalization, and price volatility, are CNS, OFG, BOKF, HFWA, and KFRC.
- Visit HEI's SEC page to see the company's official filings. To visit the company's web site, go to www.heico.com.
HEI Valuation Summary
- In comparison to the median Industrials stock, HEI's price/sales ratio is 295.24% higher, now standing at 8.3.
- HEI's price/earnings ratio has moved up 34.2 over the prior 243 months.
Below are key valuation metrics over time for HEI.
Stock | Date | P/S | P/B | P/E | EV/EBIT |
---|---|---|---|---|---|
HEI | 2023-12-29 | 8.3 | 7.9 | 61.3 | 46.0 |
HEI | 2023-12-28 | 8.3 | 7.9 | 61.3 | 46.1 |
HEI | 2023-12-27 | 8.3 | 7.9 | 61.3 | 46.0 |
HEI | 2023-12-26 | 8.4 | 7.9 | 61.7 | 46.3 |
HEI | 2023-12-22 | 8.4 | 7.9 | 61.6 | 46.2 |
HEI | 2023-12-21 | 8.3 | 7.9 | 61.3 | 46.0 |
HEI Growth Metrics
- Its 2 year net cashflow from operations growth rate is now at -12.1%.
- Its 5 year net cashflow from operations growth rate is now at 90.43%.
- Its year over year revenue growth rate is now at 18.45%.
The table below shows HEI's growth in key financial areas (numbers in millions of US dollars).
Date | Revenue | Operating Cash Flow | Net Income to Common Stock |
---|---|---|---|
2022-09-30 | 2,208.322 | 467.856 | 351.675 |
2022-06-30 | 2,108.106 | 433.891 | 340.533 |
2022-03-31 | 2,010.285 | 408.725 | 334.882 |
2021-12-31 | 1,938.123 | 414.865 | 320.545 |
2021-09-30 | 1,865.682 | 444.084 | 304.22 |
2021-06-30 | 1,782.438 | 444.257 | 280.485 |
HEI's Quality Factors
The “Quality” component of the POWR Ratings focuses on 31 different factors of a companies fundamentals and operational strength. Here are some key insights as we drill into the specifics of these quality attributes.- HEI has a Quality Grade of B, ranking ahead of 92.8% of graded US stocks.
- HEI's asset turnover comes in at 0.503 -- ranking 13th of 21 Aircraft stocks.
- ATRO, DCO, and SPR are the stocks whose asset turnover ratios are most correlated with HEI.
The table below shows HEI's key quality metrics over time.
Period | Asset Turnover | Gross Margin | ROIC |
---|---|---|---|
2021-07-31 | 0.503 | 0.384 | 0.220 |
2021-04-30 | 0.480 | 0.379 | 0.192 |
2021-01-31 | 0.489 | 0.378 | 0.197 |
2020-10-31 | 0.532 | 0.382 | 0.219 |
2020-07-31 | 0.592 | 0.384 | 0.249 |
2020-04-30 | 0.661 | 0.390 | 0.289 |
HEI Price Target
For more insight on analysts targets of HEI, see our HEI price target page. And for a list of of all stocks sorted by upside potential based on analyst target price, see our Top Price Target page.
Average Price Target | $141.82 | Average Broker Recommendation | 1.75 (Moderate Buy) |
Heico Corp. (HEI) Company Bio
HEICO Corporation is an aerospace and electronics company that focuses on niche markets. (Source:Wikipedia)
Latest HEI News From Around the Web
Below are the latest news stories about HEICO CORP that investors may wish to consider to help them evaluate HEI as an investment opportunity.
HEICO (HEI) Q4 Earnings Surpass Estimates, Sales Rise Y/YHEICO's (HEI) fiscal Q4 earnings and sales beat estimates. The company benefits from acquisitions and organic growth. |
3 Aerospace Stocks to Launch Your Portfolio to New Heights in 2024These aerospace stocks have record backlogs bolstered by soaring demand from defense and commercial aviation markets. |
HEICO Corporation (NYSE:HEI) Q4 2023 Earnings Call TranscriptHEICO Corporation (NYSE:HEI) Q4 2023 Earnings Call Transcript December 19, 2023 HEI isn’t one of the 30 most popular stocks among hedge funds at the end of the third quarter (see the details here). Operator: Welcome to the HEICO Corporation Fourth Quarter Year End 2023 Financial Results Call. My name is Samara, and I’ll be […] |
Analyst Estimates: Here's What Brokers Think Of HEICO Corporation (NYSE:HEI) After Its Full-Year ReportLast week, you might have seen that HEICO Corporation ( NYSE:HEI ) released its full-year result to the market. The... |
Decoding Heico Corp (HEI.A): A Strategic SWOT InsightUnveiling the Financial and Strategic Position of Heico Corp in the Aerospace and Defense Sector |
HEI Price Returns
1-mo | 0.49% |
3-mo | 6.84% |
6-mo | 18.02% |
1-year | 12.45% |
3-year | 54.86% |
5-year | 102.61% |
YTD | 6.84% |
2023 | 16.56% |
2022 | 6.67% |
2021 | 9.06% |
2020 | 16.16% |
2019 | 47.54% |
HEI Dividends
Ex-Dividend Date | Type | Payout Amount | Change | ||||||
---|---|---|---|---|---|---|---|---|---|
Loading, please wait... |
Continue Researching HEI
Here are a few links from around the web to help you further your research on Heico Corp's stock as an investment opportunity:Heico Corp (HEI) Stock Price | Nasdaq
Heico Corp (HEI) Stock Quote, History and News - Yahoo Finance
Heico Corp (HEI) Stock Price and Basic Information | MarketWatch
Loading social stream, please wait...