Heico Corp. (HEI): Price and Financial Metrics
HEI Price/Volume Stats
Current price | $175.90 | 52-week high | $182.18 |
Prev. close | $171.03 | 52-week low | $147.69 |
Day low | $171.83 | Volume | 492,600 |
Day high | $175.92 | Avg. volume | 335,262 |
50-day MA | $164.13 | Dividend yield | 0.12% |
200-day MA | $168.34 | Market Cap | 24.31B |
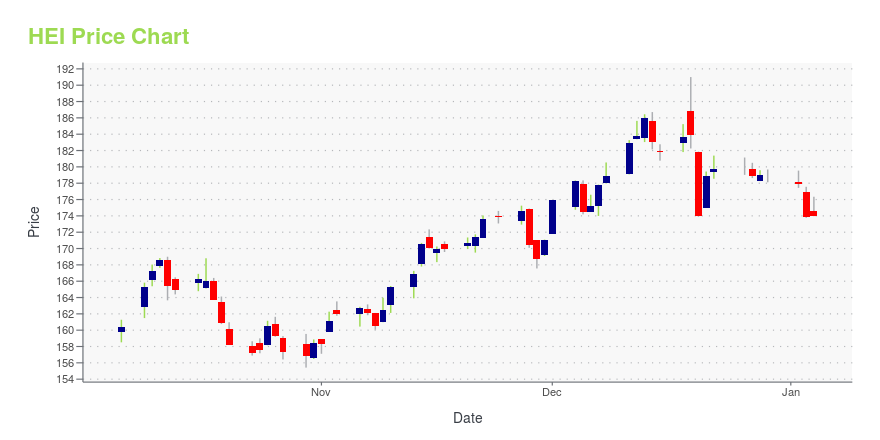
HEI Stock Price Chart Interactive Chart >
HEI POWR Grades
- HEI scores best on the Quality dimension, with a Quality rank ahead of 89.95% of US stocks.
- The strongest trend for HEI is in Growth, which has been heading down over the past 177 days.
- HEI ranks lowest in Value; there it ranks in the 6th percentile.
HEI Stock Summary
- Price to trailing twelve month operating cash flow for HEI is currently 51.42, higher than 94.33% of US stocks with positive operating cash flow.
- With a year-over-year growth in debt of 394.5%, HEICO CORP's debt growth rate surpasses 97.3% of about US stocks.
- The volatility of HEICO CORP's share price is greater than that of merely 0.97% US stocks with at least 200 days of trading history.
- Stocks that are quantitatively similar to HEI, based on their financial statements, market capitalization, and price volatility, are KFRC, MTB, HZO, B, and ROL.
- Visit HEI's SEC page to see the company's official filings. To visit the company's web site, go to www.heico.com.
HEI Valuation Summary
- HEI's price/sales ratio is 8.5; this is 672.73% higher than that of the median Industrials stock.
- Over the past 243 months, HEI's EV/EBIT ratio has gone up 24.7.
Below are key valuation metrics over time for HEI.
Stock | Date | P/S | P/B | P/E | EV/EBIT |
---|---|---|---|---|---|
HEI | 2023-11-09 | 8.5 | 7.7 | 56.5 | 42.5 |
HEI | 2023-11-08 | 8.4 | 7.6 | 55.8 | 42.0 |
HEI | 2023-11-07 | 8.5 | 7.7 | 56.4 | 42.4 |
HEI | 2023-11-06 | 8.5 | 7.7 | 56.6 | 42.6 |
HEI | 2023-11-03 | 8.5 | 7.7 | 56.3 | 42.4 |
HEI | 2023-11-02 | 8.4 | 7.6 | 56.0 | 42.2 |
HEI Growth Metrics
- Its 2 year net cashflow from operations growth rate is now at -12.1%.
- Its 5 year net cashflow from operations growth rate is now at 90.43%.
- Its year over year revenue growth rate is now at 18.45%.

The table below shows HEI's growth in key financial areas (numbers in millions of US dollars).
Date | Revenue | Operating Cash Flow | Net Income to Common Stock |
---|---|---|---|
2022-09-30 | 2,208.322 | 467.856 | 351.675 |
2022-06-30 | 2,108.106 | 433.891 | 340.533 |
2022-03-31 | 2,010.285 | 408.725 | 334.882 |
2021-12-31 | 1,938.123 | 414.865 | 320.545 |
2021-09-30 | 1,865.682 | 444.084 | 304.22 |
2021-06-30 | 1,782.438 | 444.257 | 280.485 |
HEI's Quality Factors
The “Quality” component of the POWR Ratings focuses on 31 different factors of a companies fundamentals and operational strength. Here are some key insights as we drill into the specifics of these quality attributes.- HEI has a Quality Grade of B, ranking ahead of 92.8% of graded US stocks.
- HEI's asset turnover comes in at 0.503 -- ranking 13th of 21 Aircraft stocks.
- ATRO, DCO, and SPR are the stocks whose asset turnover ratios are most correlated with HEI.
The table below shows HEI's key quality metrics over time.
Period | Asset Turnover | Gross Margin | ROIC |
---|---|---|---|
2021-07-31 | 0.503 | 0.384 | 0.220 |
2021-04-30 | 0.480 | 0.379 | 0.192 |
2021-01-31 | 0.489 | 0.378 | 0.197 |
2020-10-31 | 0.532 | 0.382 | 0.219 |
2020-07-31 | 0.592 | 0.384 | 0.249 |
2020-04-30 | 0.661 | 0.390 | 0.289 |
HEI Price Target
For more insight on analysts targets of HEI, see our HEI price target page. And for a list of of all stocks sorted by upside potential based on analyst target price, see our Top Price Target page.
Average Price Target | $141.82 | Average Broker Recommendation | 1.75 (Moderate Buy) |
Heico Corp. (HEI) Company Bio
HEICO Corporation is an aerospace and electronics company that focuses on niche markets. (Source:Wikipedia)
Latest HEI News From Around the Web
Below are the latest news stories about HEICO CORP that investors may wish to consider to help them evaluate HEI as an investment opportunity.
DRS vs. HEI: Which Stock Is the Better Value Option?DRS vs. HEI: Which Stock Is the Better Value Option? |
Does HEICO (NYSE:HEI) Deserve A Spot On Your Watchlist?Investors are often guided by the idea of discovering 'the next big thing', even if that means buying 'story stocks... |
BAESY or HEI: Which Is the Better Value Stock Right Now?BAESY vs. HEI: Which Stock Is the Better Value Option? |
VPT, Inc. Commemorates 30th AnniversaryVPT, Inc., a HEICO company (NYSE:HEI.A) (NYSE:HEI), celebrates its 30th Anniversary this year. Throughout the last three decades, VPT has become the global leader in providing high-reliability power supplies for use in space, avionics, and military applications, with an extensive range of award-winning DC-DC converters, EMI filters, and associated products. |
HEICO (NYSE:HEI) sheds 4.1% this week, as yearly returns fall more in line with earnings growthWhile HEICO Corporation ( NYSE:HEI ) shareholders are probably generally happy, the stock hasn't had particularly good... |
HEI Price Returns
1-mo | 8.58% |
3-mo | N/A |
6-mo | 10.40% |
1-year | 6.93% |
3-year | 34.21% |
5-year | 113.81% |
YTD | 14.63% |
2022 | 6.67% |
2021 | 9.06% |
2020 | 16.16% |
2019 | 47.54% |
2018 | 28.49% |
HEI Dividends
Ex-Dividend Date | Type | Payout Amount | Change | ||||||
---|---|---|---|---|---|---|---|---|---|
Loading, please wait... |
Continue Researching HEI
Here are a few links from around the web to help you further your research on Heico Corp's stock as an investment opportunity:Heico Corp (HEI) Stock Price | Nasdaq
Heico Corp (HEI) Stock Quote, History and News - Yahoo Finance
Heico Corp (HEI) Stock Price and Basic Information | MarketWatch
Loading social stream, please wait...