
Hillenbrand Inc (HI): Price and Financial Metrics
HI Price/Volume Stats
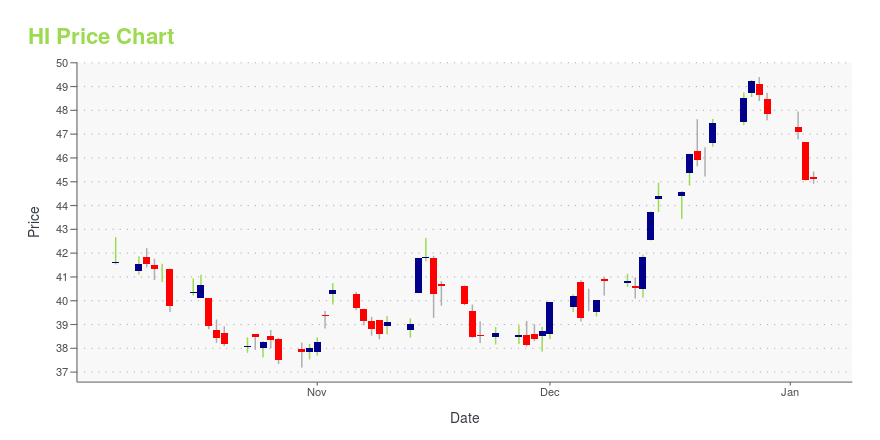
| Current price | $49.23 | 52-week high | $53.76 |
| Prev. close | $48.45 | 52-week low | $37.19 |
| Day low | $48.56 | Volume | 18,907 |
| Day high | $49.25 | Avg. volume | 282,982 |
| 50-day MA | $48.08 | Dividend yield | 1.81% |
| 200-day MA | $45.20 | Market Cap | 3.45B |
HI Stock Price Chart Interactive Chart >
Hillenbrand Inc (HI) Company Bio
Hillenbrand designs, produces, markets, and services equipment and systems used in processing applications, as well as offers compounding and extruding equipment, bulk materials handling systems, and related engineering services. The company was founded in 1845 and based in Batesville, Indiana.
Latest HI News From Around the Web
Below are the latest news stories about HILLENBRAND INC that investors may wish to consider to help them evaluate HI as an investment opportunity.
Hillenbrand (NYSE:HI) Is Increasing Its Dividend To $0.2225Hillenbrand, Inc. ( NYSE:HI ) has announced that it will be increasing its periodic dividend on the 29th of December to... |
Insider Buying: President & CEO Kimberly Ryan Acquires Shares of Hillenbrand IncInsider buying and selling activities are closely monitored by investors as they can provide insights into a company's internal perspective. |
Hillenbrand Declares First Quarter Dividend of $0.2225 Per ShareThe board of directors of Hillenbrand, Inc. (NYSE: HI) has declared a regular quarterly cash dividend of $0.2225 per share on the company's common stock. On an annualized basis, this is an increase of $0.01 per share to a total rate of $0.89 per share in fiscal 2024. The dividend is payable December 29, 2023, to shareholders of record at the close of business on December 15, 2023. |
Is Hillenbrand, Inc.'s (NYSE:HI) 6.9% ROE Worse Than Average?While some investors are already well versed in financial metrics (hat tip), this article is for those who would like... |
Hillenbrand, Inc. (NYSE:HI) Q4 2023 Earnings Call TranscriptHillenbrand, Inc. (NYSE:HI) Q4 2023 Earnings Call Transcript November 16, 2023 Operator: Greetings and welcome to the Hillenbrand Fourth Quarter Fiscal Year 2023 Earnings Call. At this time all participants’ are in a listen-only mode. A question-and-answer session will follow the formal presentation. [Operator Instructions] As a reminder this conference is being recorded. I would […] |
HI Price Returns
| 1-mo | -1.26% |
| 3-mo | 6.52% |
| 6-mo | 32.59% |
| 1-year | 11.68% |
| 3-year | 5.17% |
| 5-year | 29.11% |
| YTD | 3.36% |
| 2023 | 14.37% |
| 2022 | -16.24% |
| 2021 | 33.09% |
| 2020 | 23.48% |
| 2019 | -10.09% |
HI Dividends
| Ex-Dividend Date | Type | Payout Amount | Change | ||||||
|---|---|---|---|---|---|---|---|---|---|
| Loading, please wait... | |||||||||
Continue Researching HI
Here are a few links from around the web to help you further your research on Hillenbrand Inc's stock as an investment opportunity:Hillenbrand Inc (HI) Stock Price | Nasdaq
Hillenbrand Inc (HI) Stock Quote, History and News - Yahoo Finance
Hillenbrand Inc (HI) Stock Price and Basic Information | MarketWatch
Loading social stream, please wait...