
HNI Corporation (HNI): Price and Financial Metrics
HNI Price/Volume Stats
| Current price | $54.50 | 52-week high | $54.77 |
| Prev. close | $53.94 | 52-week low | $27.92 |
| Day low | $52.90 | Volume | 563,715 |
| Day high | $54.77 | Avg. volume | 252,458 |
| 50-day MA | $46.04 | Dividend yield | 2.63% |
| 200-day MA | $42.34 | Market Cap | 2.58B |
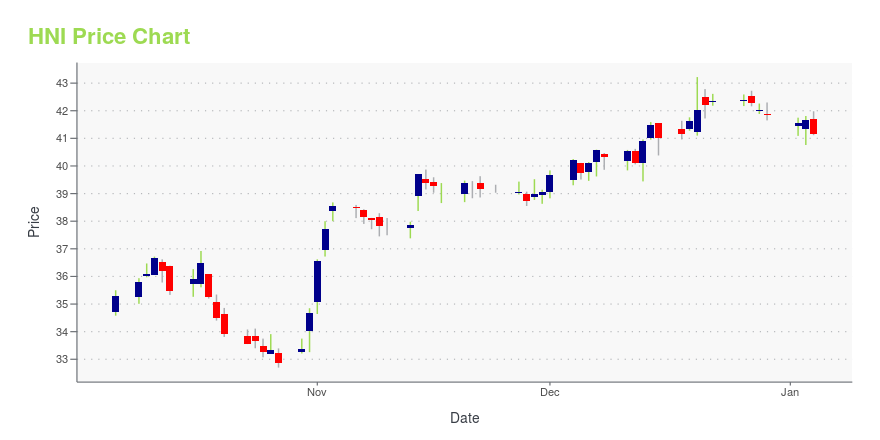
HNI Stock Price Chart Interactive Chart >
HNI Corporation (HNI) Company Bio
HNI Corporation engages in the design, manufacture, and marketing of office furniture and hearth products primarily in the United States, Canada, China, Hong Kong, India, and Taiwan. The company was founded in 1944 and is based in Muscatine, Iowa.
Latest HNI News From Around the Web
Below are the latest news stories about HNI CORP that investors may wish to consider to help them evaluate HNI as an investment opportunity.
HNI (HNI) is on the Move, Here's Why the Trend Could be SustainableHNI (HNI) could be a great choice for investors looking to make a profit from fundamentally strong stocks that are currently on the move. It is one of the several stocks that made it through our "Recent Price Strength" screen. |
HNI Corporation's (NYSE:HNI) P/E Is On The MarkHNI Corporation's ( NYSE:HNI ) price-to-earnings (or "P/E") ratio of 44.6x might make it look like a strong sell right... |
HNI Corporation Ranks Among America's Most Responsible Companies for 2024MUSCATINE, Iowa, December 11, 2023--HNI Corporation (NYSE: HNI) announced today it has again been recognized among America’s Most Responsible Companies, ranking number six among consumer goods companies and number 31 in the overall ranking on Newsweek's 2024 list. For the fifth year in a row HNI has ranked high on this list of the top 600 most responsible companies in the United States. |
Zacks.com featured highlights Griffon, Arcos Dorados, HNI and H&E EquipmentGriffon, Arcos Dorados, HNI and H&E Equipment have been highlighted in this Screen of The Week article. |
Recent Price Trend in HNI (HNI) is Your Friend, Here's WhyIf you are looking for stocks that are well positioned to maintain their recent uptrend, HNI (HNI) could be a great choice. It is one of the several stocks that passed through our "Recent Price Strength" screen. |
HNI Price Returns
| 1-mo | 23.28% |
| 3-mo | 29.19% |
| 6-mo | 33.75% |
| 1-year | 96.06% |
| 3-year | 53.48% |
| 5-year | 91.54% |
| YTD | 32.25% |
| 2023 | 53.16% |
| 2022 | -29.89% |
| 2021 | 25.86% |
| 2020 | -4.24% |
| 2019 | 9.30% |
HNI Dividends
| Ex-Dividend Date | Type | Payout Amount | Change | ||||||
|---|---|---|---|---|---|---|---|---|---|
| Loading, please wait... | |||||||||
Continue Researching HNI
Want to do more research on Hni Corp's stock and its price? Try the links below:Hni Corp (HNI) Stock Price | Nasdaq
Hni Corp (HNI) Stock Quote, History and News - Yahoo Finance
Hni Corp (HNI) Stock Price and Basic Information | MarketWatch
Loading social stream, please wait...