
Harley-Davidson, Inc. (HOG): Price and Financial Metrics
HOG Price/Volume Stats
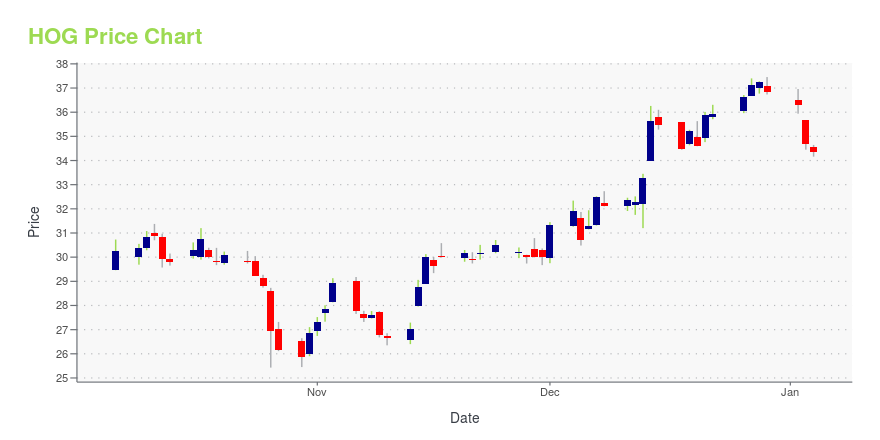
| Current price | $36.83 | 52-week high | $44.16 |
| Prev. close | $36.39 | 52-week low | $25.43 |
| Day low | $35.25 | Volume | 4,303,039 |
| Day high | $37.33 | Avg. volume | 1,737,421 |
| 50-day MA | $34.33 | Dividend yield | 1.99% |
| 200-day MA | $34.74 | Market Cap | 4.95B |
HOG Stock Price Chart Interactive Chart >
Harley-Davidson, Inc. (HOG) Company Bio
Harley-Davidson designs, manufactures, and sells wholesale street-legal Harley-Davidson motorcycles, as well as a line of motorcycle parts, accessories, general merchandise, and related services. The company was founded in 1903 and is based in Milwaukee, Wisconsin.
Latest HOG News From Around the Web
Below are the latest news stories about HARLEY-DAVIDSON INC that investors may wish to consider to help them evaluate HOG as an investment opportunity.
3 Incredibly Cheap Dividend StocksHere are dividend-paying stocks that are trading at a discount and merit a look from income investors. |
The secrets of a boy racerAt least I thought I had, until Harley-Davidson recently offered me a fortnight’s loan of its craftily named Freewheeler, a luxury trike powered not by feeble, four-year-old legs but by one of Milwaukee’s finest V-Twin engines, with 114 cubic inches of capacity. Despite having ridden motorcycles for longer than I care to admit, I was plagued by feelings of trepidation during the journey to collect the Freewheeler – in photographs, it looked wide, heavy and ungainly. For anyone looking to experience the impressive torque and famous throb of a Harley-Davidson V-Twin engine without having to heave a heavy two-wheeler onto its stand or hold it upright at traffic lights and junctions, the Freewheeler is definitely the way to go. |
As Harley-Davidson (NYSE:HOG) climbs 9.7% this past week, investors may now be noticing the company's one-year earnings growthHarley-Davidson, Inc. ( NYSE:HOG ) shareholders should be happy to see the share price up 24% in the last month. But... |
3 EV Stocks to Turn $10,000 Into $1 MillionElectric vehicles are undoubtedly a great alternative for the future. |
Harley-Davidson Inc's Dividend AnalysisHarley-Davidson Inc (NYSE:HOG) recently announced a dividend of $0.17 per share, payable on 2023-12-27, with the ex-dividend date set for 2023-12-08. As investors look forward to this upcoming payment, the spotlight also shines on the company's dividend history, yield, and growth rates. Using the data from GuruFocus, let's look into Harley-Davidson Inc's dividend performance and assess its sustainability. |
HOG Price Returns
| 1-mo | 9.52% |
| 3-mo | 6.51% |
| 6-mo | 10.51% |
| 1-year | -0.36% |
| 3-year | -2.06% |
| 5-year | 12.80% |
| YTD | 0.95% |
| 2023 | -9.76% |
| 2022 | 12.12% |
| 2021 | 4.29% |
| 2020 | 0.19% |
| 2019 | 13.62% |
HOG Dividends
| Ex-Dividend Date | Type | Payout Amount | Change | ||||||
|---|---|---|---|---|---|---|---|---|---|
| Loading, please wait... | |||||||||
Continue Researching HOG
Want to do more research on Harley-Davidson Inc's stock and its price? Try the links below:Harley-Davidson Inc (HOG) Stock Price | Nasdaq
Harley-Davidson Inc (HOG) Stock Quote, History and News - Yahoo Finance
Harley-Davidson Inc (HOG) Stock Price and Basic Information | MarketWatch
Loading social stream, please wait...