Hope Bancorp, Inc. (HOPE): Price and Financial Metrics

Hope Bancorp, Inc. (HOPE): $11.03

0.24 (+2.22%)

POWR Rating

Component Grades

Momentum

C

Stability

C

Sentiment

Quality

C

Add HOPE to Watchlist
Sign Up

Industry: Pacific Regional Banks

Industry

F

Ranked

#15 of 43

in industry

HOPE Price/Volume Stats

Current price $11.03 52-week high $13.81
Prev. close $10.79 52-week low $7.42
Day low $10.78 Volume 860,042
Day high $11.05 Avg. volume 925,800
50-day MA $9.37 Dividend yield 5.36%
200-day MA $9.47 Market Cap 1.32B

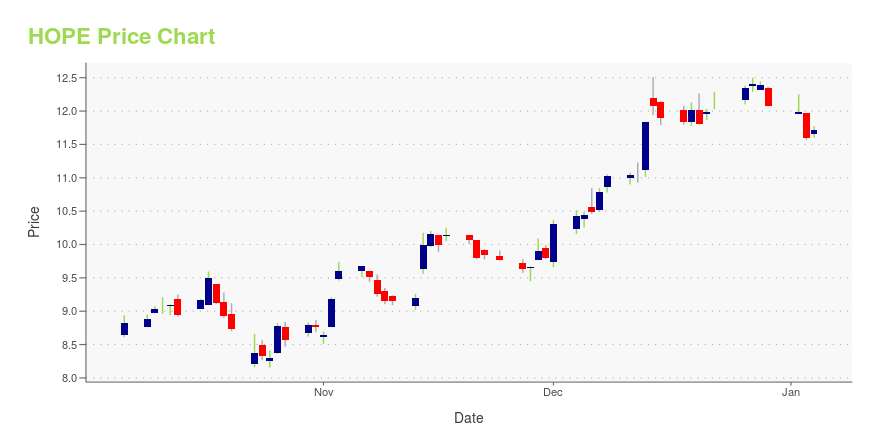
HOPE Stock Price Chart Interactive Chart >

HOPE POWR Grades

  • HOPE scores best on the Value dimension, with a Value rank ahead of 86.46% of US stocks.
  • The strongest trend for HOPE is in Quality, which has been heading up over the past 177 days.
  • HOPE ranks lowest in Growth; there it ranks in the 11th percentile.

HOPE Stock Summary

  • Price to trailing twelve month operating cash flow for HOPE is currently 2.41, higher than merely 7.92% of US stocks with positive operating cash flow.
  • HOPE's equity multiplier -- a measure of assets relative to shareholders'equity -- is greater than that of 89.47% of US stocks.
  • Shareholder yield, a measure of how much is returned to shareholders via dividends and share repurchases, for HOPE comes in at -35.53% -- higher than that of merely 11.16% of stocks in our set.
  • Stocks that are quantitatively similar to HOPE, based on their financial statements, market capitalization, and price volatility, are FLIC, BHB, ONB, MBWM, and BANC.
  • HOPE's SEC filings can be seen here. And to visit HOPE BANCORP INC's official web site, go to www.bankofhope.com.

HOPE Valuation Summary

  • In comparison to the median Financial Services stock, HOPE's EV/EBIT ratio is 74.11% lower, now standing at 2.9.
  • Over the past 243 months, HOPE's price/sales ratio has gone down 2.7.

Below are key valuation metrics over time for HOPE.

Stock Date P/S P/B P/E EV/EBIT
HOPE 2023-11-28 2.1 0.6 7.3 2.9
HOPE 2023-11-27 2.1 0.6 7.3 2.9
HOPE 2023-11-24 2.1 0.6 7.4 3.0
HOPE 2023-11-22 2.1 0.6 7.4 3.0
HOPE 2023-11-21 2.1 0.6 7.4 3.0
HOPE 2023-11-20 2.1 0.6 7.6 3.1

HOPE Growth Metrics

    Its 2 year cash and equivalents growth rate is now at -64.87%.
  • Its year over year cash and equivalents growth rate is now at -27.47%.
  • Its 5 year net cashflow from operations growth rate is now at -7.15%.
Over the past 67 months, HOPE's revenue has gone up $157,502,000.

The table below shows HOPE's growth in key financial areas (numbers in millions of US dollars).

Date Revenue Operating Cash Flow Net Income to Common Stock
2022-09-30 610.702 468.582 218.197
2022-06-30 604.274 448.972 219.948
2022-03-31 597.843 449.755 221.623
2021-12-31 568.564 324.211 204.572
2021-09-30 528.32 266.518 181.268
2021-06-30 490.557 207.992 156.259

HOPE's Quality Factors

The “Quality” component of the POWR Ratings focuses on 31 different factors of a companies fundamentals and operational strength. Here are some key insights as we drill into the specifics of these quality attributes.
  • HOPE has a Quality Grade of C, ranking ahead of 35.52% of graded US stocks.
  • HOPE's asset turnover comes in at 0.029 -- ranking 388th of 428 Banking stocks.
  • CCBG, TSC, and FITB are the stocks whose asset turnover ratios are most correlated with HOPE.

The table below shows HOPE's key quality metrics over time.

Period Asset Turnover Gross Margin ROIC
2021-06-30 0.029 1 0.012
2021-03-31 0.026 1 0.010
2020-12-31 0.025 1 0.009
2020-09-30 0.027 1 0.010
2020-06-30 0.029 1 0.012
2020-03-31 0.031 1 0.013

HOPE Price Target

For more insight on analysts targets of HOPE, see our HOPE price target page. And for a list of of all stocks sorted by upside potential based on analyst target price, see our Top Price Target page.

Average Price Target $15.20 Average Broker Recommendation 2 (Hold)

Hope Bancorp, Inc. (HOPE) Company Bio


Hope Bancorp, Inc. operates as the bank holding company for Bank of Hope that provides commercial banking services primarily to small- to medium-sized businesses and individuals in the United States. The company was formerly known as BBCN Bancorp, Inc. and changed its name to Hope Bancorp, Inc. in August 2016. Hope Bancorp, Inc. is based in Los Angeles, California.


HOPE Latest News Stream


Event/Time News Detail
Loading, please wait...

HOPE Latest Social Stream


Loading social stream, please wait...

View Full HOPE Social Stream

Latest HOPE News From Around the Web

Below are the latest news stories about HOPE BANCORP INC that investors may wish to consider to help them evaluate HOPE as an investment opportunity.

Is It Smart To Buy Hope Bancorp, Inc. (NASDAQ:HOPE) Before It Goes Ex-Dividend?

Readers hoping to buy Hope Bancorp, Inc. ( NASDAQ:HOPE ) for its dividend will need to make their move shortly, as the...

Yahoo | October 27, 2023

Hope Bancorp (NASDAQ:HOPE) Is Paying Out A Dividend Of $0.14

The board of Hope Bancorp, Inc. ( NASDAQ:HOPE ) has announced that it will pay a dividend of $0.14 per share on the...

Yahoo | October 26, 2023

Hope Bancorp, Inc. (NASDAQ:HOPE) Q3 2023 Earnings Call Transcript

Hope Bancorp, Inc. (NASDAQ:HOPE) Q3 2023 Earnings Call Transcript October 23, 2023 Hope Bancorp, Inc. misses on earnings expectations. Reported EPS is $0.25 EPS, expectations were $0.26. Operator: Good day, and welcome to the Hope Bancorp’s 2023 Third Quarter Earnings Conference Call. All participants will be in listen-only mode. [Operator Instructions] After today’s presentation, there […]

Yahoo | October 24, 2023

Q3 2023 Hope Bancorp Inc Earnings Call

Q3 2023 Hope Bancorp Inc Earnings Call

Yahoo | October 24, 2023

Compared to Estimates, Hope Bancorp (HOPE) Q3 Earnings: A Look at Key Metrics

Although the revenue and EPS for Hope Bancorp (HOPE) give a sense of how its business performed in the quarter ended September 2023, it might be worth considering how some key metrics compare with Wall Street estimates and the year-ago numbers.

Yahoo | October 23, 2023

Read More 'HOPE' Stories Here

HOPE Price Returns

1-mo 19.11%
3-mo 19.76%
6-mo 25.64%
1-year -11.68%
3-year 18.82%
5-year 1.18%
YTD -8.78%
2022 -9.57%
2021 40.48%
2020 -22.02%
2019 30.29%
2018 -32.83%

HOPE Dividends

Ex-Dividend Date Type Payout Amount Change
Loading, please wait...
View Full HOPE Dividend History

Get Free Updates

Join thousands of investors who get the latest news, insights and top rated picks from StockNews.com!