Helmerich & Payne, Inc. (HP): Price and Financial Metrics


Helmerich & Payne, Inc. (HP): $35.45

1.28 (+3.75%)

POWR Rating

Component Grades

Growth

S

Value

I

Momentum

G

Stability

N

Sentiment

U

Quality

P

HP POWR Grades

  • Momentum is the dimension where HP ranks best; there it ranks ahead of 99.67% of US stocks.
  • HP's strongest trending metric is Growth; it's been moving up over the last 178 days.
  • HP's current lowest rank is in the Stability metric (where it is better than 15.57% of US stocks).

HP Stock Summary

  • HP's went public 37.24 years ago, making it older than 93.42% of listed US stocks we're tracking.
  • Over the past twelve months, HP has reported earnings growth of -163.04%, putting it ahead of just 9.68% of US stocks in our set.
  • Revenue growth over the past 12 months for HELMERICH & PAYNE INC comes in at 71.41%, a number that bests 89.53% of the US stocks we're tracking.
  • Stocks with similar financial metrics, market capitalization, and price volatility to HELMERICH & PAYNE INC are GOCO, VCSA, CLVR, EGY, and CDLX.
  • Visit HP's SEC page to see the company's official filings. To visit the company's web site, go to www.hpinc.com.

HP Valuation Summary

  • In comparison to the median Energy stock, HP's price/sales ratio is 0% higher, now standing at 1.5.
  • HP's price/sales ratio has moved down 1.3 over the prior 243 months.

Below are key valuation metrics over time for HP.

Stock Date P/S P/B P/E EV/EBIT
HP 2023-03-17 1.5 1.3 23.0 16.2
HP 2023-03-16 1.5 1.3 23.5 16.6
HP 2023-03-15 1.6 1.4 23.9 16.8
HP 2023-03-14 1.7 1.4 25.2 17.7
HP 2023-03-13 1.6 1.4 25.0 17.5
HP 2023-03-10 1.7 1.5 26.5 18.5

HP Growth Metrics

    The year over year net cashflow from operations growth rate now stands at -73.56%.
  • Its 4 year net cashflow from operations growth rate is now at 66.74%.
  • Its 5 year net cashflow from operations growth rate is now at 66.74%.
HP's revenue has moved down $118,469,000 over the prior 52 months.

The table below shows HP's growth in key financial areas (numbers in millions of US dollars).

Date Revenue Operating Cash Flow Net Income to Common Stock
2022-12-31 2,368.799 423.006 155.46
2022-09-30 2,058.944 233.913 6.953
2022-06-30 1,771.419 163.26 -117.747
2022-03-31 1,553.399 96.534 -191.054
2021-12-31 1,381.973 152.326 -307.081
2021-09-30 1,218.568 136.44 -326.15

HP's Quality Factors

The “Quality” component of the POWR Ratings focuses on 31 different factors of a companies fundamentals and operational strength. Here are some key insights as we drill into the specifics of these quality attributes.
  • HP has a Quality Grade of C, ranking ahead of 55.34% of graded US stocks.
  • HP's asset turnover comes in at 0.232 -- ranking 104th of 137 Petroleum and Natural Gas stocks.
  • RNGR, CCLP, and PXD are the stocks whose asset turnover ratios are most correlated with HP.

The table below shows HP's key quality metrics over time.

Period Asset Turnover Gross Margin ROIC
2021-06-30 0.232 0.218 -0.087
2021-03-31 0.224 0.254 -0.079
2020-12-31 0.285 0.300 -0.157
2020-09-30 0.341 0.332 -0.120
2020-06-30 0.406 0.348 -0.092
2020-03-31 0.454 0.349 -0.112

HP Price Target

For more insight on analysts targets of HP, see our HP price target page. And for a list of of all stocks sorted by upside potential based on analyst target price, see our Top Price Target page.

Average Price Target $31.13 Average Broker Recommendation 1.74 (Moderate Buy)

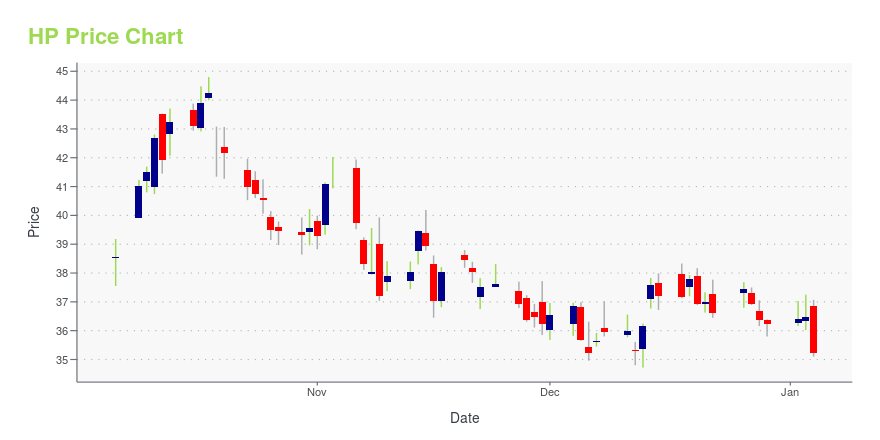
HP Stock Price Chart Interactive Chart >

Price chart for HP

HP Price/Volume Stats

Current price $35.45 52-week high $54.59
Prev. close $34.17 52-week low $33.54
Day low $34.37 Volume 843,910
Day high $35.84 Avg. volume 1,468,082
50-day MA $44.35 Dividend yield 2.86%
200-day MA $44.81 Market Cap 3.70B

Helmerich & Payne, Inc. (HP) Company Bio


Helmerich & Payne operates as a contract drilling company in South America, the Middle East, and Africa. It provides drilling rigs, equipment, personnel, and camps on a contract basis to explore for and develop oil and gas from onshore areas and fixed platforms, tension-leg platforms, and spars in offshore areas. The company was founded in 1920 and is based in Tulsa, Oklahoma.


HP Latest News Stream


Event/Time News Detail
Loading, please wait...

HP Latest Social Stream


Loading social stream, please wait...

View Full HP Social Stream

Latest HP News From Around the Web

Below are the latest news stories about HELMERICH & PAYNE INC that investors may wish to consider to help them evaluate HP as an investment opportunity.

Helmerich & Payne, Inc. To Participate in Conferences in March 2023

TULSA, Okla., March 16, 2023--Helmerich & Payne, Inc. (NYSE: HP) today announced that John Lindsay, President and Chief Executive Officer; Mark Smith, Senior Vice President and Chief Financial Officer; Trey Adams, Senior Vice President of Digital Operations, Sales, and Marketing; and Dave Wilson, Vice President of Investor Relations plan to participate in the following investor conferences during the month of March 2023. Participation by the management team will vary by event.

Yahoo | March 16, 2023

Helmerich & Payne (HP) Gains But Lags Market: What You Should Know

Helmerich & Payne (HP) closed the most recent trading day at $37.54, moving +0.86% from the previous trading session.

Yahoo | March 14, 2023

Is There An Opportunity With Helmerich & Payne, Inc.'s (NYSE:HP) 36% Undervaluation?

Key Insights Helmerich & Payne's estimated fair value is US$58.39 based on 2 Stage Free Cash Flow to Equity Helmerich...

Yahoo | March 14, 2023

Zacks Industry Outlook Highlights Helmerich & Payne, Nabors Industries and Precision Drilling

Helmerich & Payne, Nabors Industries and Precision Drilling have been highlighted in this Industry Outlook article.

Yahoo | March 10, 2023

3 Oil & Gas Drilling Stocks to Make It Through Macro Headwinds

Despite the choppy activity trends associated with the Zacks Oil and Gas - Drilling industry, we advise focusing on fundamentally sound companies like HP, NBR and PDS.

Yahoo | March 9, 2023

Read More 'HP' Stories Here

HP Price Returns

1-mo -16.41%
3-mo -26.11%
6-mo -11.47%
1-year -9.08%
3-year 212.64%
5-year -33.52%
YTD -27.72%
2022 115.23%
2021 6.19%
2020 -44.28%
2019 0.49%
2018 -22.58%

HP Dividends

Ex-Dividend Date Type Payout Amount Change
Loading, please wait...
View Full HP Dividend History

Continue Researching HP

Here are a few links from around the web to help you further your research on Helmerich & Payne Inc's stock as an investment opportunity:

Helmerich & Payne Inc (HP) Stock Price | Nasdaq
Helmerich & Payne Inc (HP) Stock Quote, History and News - Yahoo Finance
Helmerich & Payne Inc (HP) Stock Price and Basic Information | MarketWatch

Get Free Updates

Join thousands of investors who get the latest news, insights and top rated picks from StockNews.com!


Page generated in 0.9207 seconds.