
Hormel Foods Corp. (HRL): Price and Financial Metrics
HRL Price/Volume Stats
| Current price | $32.01 | 52-week high | $41.73 |
| Prev. close | $31.84 | 52-week low | $28.51 |
| Day low | $31.77 | Volume | 1,631,970 |
| Day high | $32.10 | Avg. volume | 2,781,574 |
| 50-day MA | $31.76 | Dividend yield | 3.62% |
| 200-day MA | $32.44 | Market Cap | 17.55B |
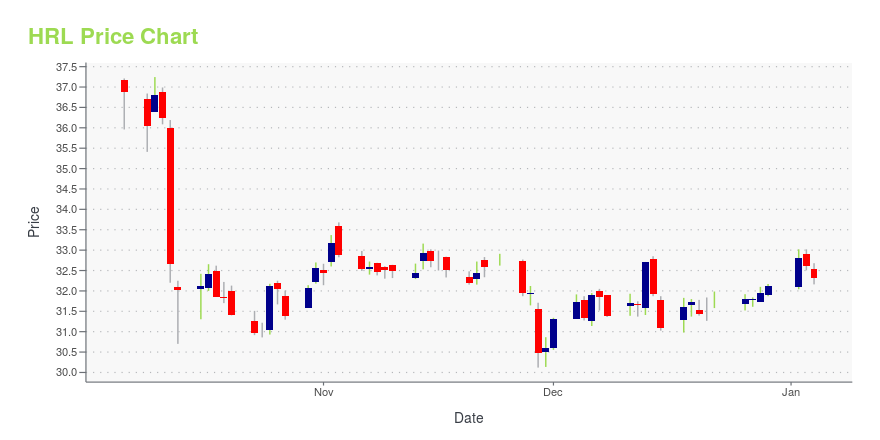
HRL Stock Price Chart Interactive Chart >
Hormel Foods Corp. (HRL) Company Bio
Hormel Foods Corporation is an American food processing company founded in 1891 in Austin, Minnesota, by George A. Hormel as George A. Hormel & Company. The company originally focused on the packaging and selling of ham, sausage and other pork, chicken, beef and lamb products to consumers, adding Spam in 1937. By the 1980s, Hormel began offering a wider range of packaged and refrigerated foods. The company changed its name to Hormel Foods Corporation in 1993, and uses the Hormel brand on many of its products; the company's other brands include Planters, Columbus Craft Meats, Dinty Moore, Jennie-O, and Skippy. The company's products are available in 80 countries. (Source:Wikipedia)
Latest HRL News From Around the Web
Below are the latest news stories about HORMEL FOODS CORP that investors may wish to consider to help them evaluate HRL as an investment opportunity.
3 Safe Dividend Stocks With Low Payout RatiosThese three dividend stocks are compelling picks due to their yields and low payout ratios. |
Here's Why Hormel Foods (HRL) Dropped More Than 15% in 3 MonthsHormel Foods (HRL) continues to operate in a dynamic operating landscape, including sluggish consumer demand and inflationary hurdles. |
15 Highest Quality Steakhouse Chains In The USIn this article, we shall discuss the 15 highest quality steakhouse chains in the US. To skip our detailed analysis of the global meat industry and a brief overview of the restaurant industry in 2023, go directly and see 5 Highest Quality Steakhouse Chains in the US. According to a market research report by the […] |
Centi-Billionaire Bill Gates’ Top 15 Dividend StocksIn this article, we discuss centi-billionaire Bill Gates’ top 15 dividend stocks. You can skip our detailed analysis of Bill Gates’ investment philosophy and his major investments, and go directly to read Bill Gates’ Top 5 Dividend Stocks. Every investor dreams of accumulating higher returns and making massive profits while investing in the equity markets. […] |
Newsweek Names Hormel Foods One of America's Greatest Workplaces for DiversityHormel Foods Corporation (NYSE: HRL), a Fortune 500 global branded food company, has been named one of America's greatest workplaces for diversity by Newsweek magazine. |
HRL Price Returns
| 1-mo | 6.90% |
| 3-mo | -8.54% |
| 6-mo | 5.09% |
| 1-year | -18.44% |
| 3-year | -27.19% |
| 5-year | -12.61% |
| YTD | 2.33% |
| 2023 | -27.49% |
| 2022 | -4.67% |
| 2021 | 6.99% |
| 2020 | 5.39% |
| 2019 | 7.85% |
HRL Dividends
| Ex-Dividend Date | Type | Payout Amount | Change | ||||||
|---|---|---|---|---|---|---|---|---|---|
| Loading, please wait... | |||||||||
Continue Researching HRL
Here are a few links from around the web to help you further your research on Hormel Foods Corp's stock as an investment opportunity:Hormel Foods Corp (HRL) Stock Price | Nasdaq
Hormel Foods Corp (HRL) Stock Quote, History and News - Yahoo Finance
Hormel Foods Corp (HRL) Stock Price and Basic Information | MarketWatch
Loading social stream, please wait...