
Heritage Insurance Holdings, Inc. (HRTG): Price and Financial Metrics
HRTG Price/Volume Stats
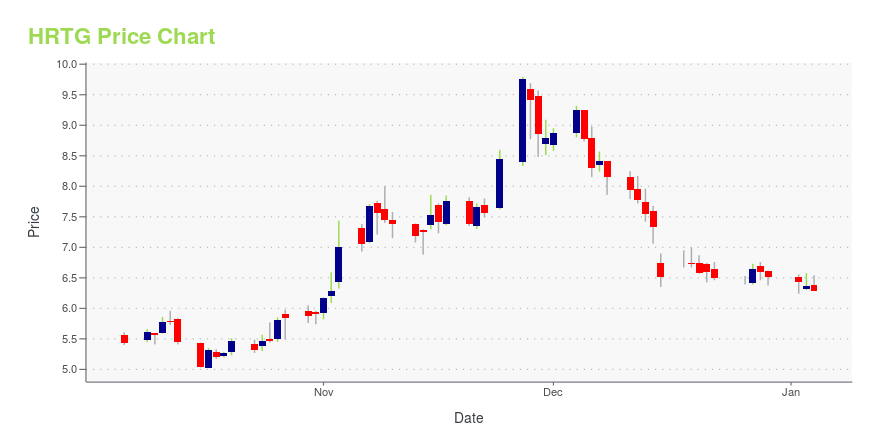
| Current price | $7.75 | 52-week high | $11.23 |
| Prev. close | $7.59 | 52-week low | $4.25 |
| Day low | $7.62 | Volume | 172,141 |
| Day high | $7.85 | Avg. volume | 408,357 |
| 50-day MA | $7.65 | Dividend yield | N/A |
| 200-day MA | $7.60 | Market Cap | 237.43M |
HRTG Stock Price Chart Interactive Chart >
Heritage Insurance Holdings, Inc. (HRTG) Company Bio
Heritage Insurance Holdings Inc. operates as a property and casualty insurance holding company in the state of Florida. The company was founded in 2012 and is based in Clearwater, Florida.
Latest HRTG News From Around the Web
Below are the latest news stories about HERITAGE INSURANCE HOLDINGS INC that investors may wish to consider to help them evaluate HRTG as an investment opportunity.
Heritage Announces Closing of Primary Public Offering of Shares of Common Stock and Concurrent Private PlacementHeritage Insurance Holdings, Inc. (NYSE: HRTG) ("Heritage," or the "Company"), a super-regional property and casualty insurance holding company, today announced the completion of a primary offering of 3,703,703 shares of its common stock, at a public offering price of $6.75 per share (the "Public Offering"). In addition, the underwriter has a 30-day option to purchase up to an additional 555,555 shares of common stock at the public offering price less underwriting discounts and commissions. |
Heritage Insurance Holdings Inc CEO Ernie Garateix's Strategic Insider BuyingInsider buying is often regarded as a bullish signal in the stock market, as it suggests that those with the most intimate knowledge of a company's operations believe in its future prospects. |
Director Paul Whiting's Strategic Purchase of Heritage Insurance Holdings Inc SharesOn December 14, 2023, a notable transaction occurred within Heritage Insurance Holdings Inc (NYSE:HRTG), a company specializing in personal and commercial residential insurance products. |
Heritage Announces Pricing of Primary Offering of Shares of Common StockHeritage Insurance Holdings, Inc., (NYSE: HRTG) ("Heritage" or the "Company"), a super-regional property and casualty insurance holding company, today announced that it has priced its previously announced underwritten public offering of 3,703,703 shares of common stock at a public offering price of $6.75 per share (the "Offering"). All shares are being sold by Heritage. The gross proceeds to Heritage from the Offering, before deducting underwriting discounts, commissions and other offering expen |
Heritage Announces Launch of Primary Offering of Shares of Common StockHeritage Insurance Holdings, Inc., (NYSE: HRTG) ("Heritage" or the "Company"), a super-regional property and casualty insurance holding company, today announced that it is commencing an underwritten public offering of its shares of common stock (the "Offering"). Heritage also expects to grant to the underwriters for the Offering, a 30-day option to purchase up to an additional 15% of the number of shares of common stock offered in the Offering. All of the shares to be sold in the Offering will b |
HRTG Price Returns
| 1-mo | 9.62% |
| 3-mo | -24.68% |
| 6-mo | 25.00% |
| 1-year | 68.48% |
| 3-year | 10.05% |
| 5-year | -37.37% |
| YTD | 18.87% |
| 2023 | 262.22% |
| 2022 | -68.58% |
| 2021 | -40.09% |
| 2020 | -21.80% |
| 2019 | -8.50% |
Continue Researching HRTG
Want to see what other sources are saying about Heritage Insurance Holdings Inc's financials and stock price? Try the links below:Heritage Insurance Holdings Inc (HRTG) Stock Price | Nasdaq
Heritage Insurance Holdings Inc (HRTG) Stock Quote, History and News - Yahoo Finance
Heritage Insurance Holdings Inc (HRTG) Stock Price and Basic Information | MarketWatch
Loading social stream, please wait...