Hershey Co. (HSY): Price and Financial Metrics

Hershey Co. (HSY): $255.02

-4.46 (-1.72%)

POWR Rating

Component Grades

Momentum

D

Stability

C

Sentiment

Quality

A

Add HSY to Watchlist
Sign Up

Industry: Food Makers

Industry

B

Ranked

#14 of 80

in industry

HSY Price/Volume Stats

Current price $255.02 52-week high $276.88
Prev. close $259.48 52-week low $201.63
Day low $254.06 Volume 530,880
Day high $261.19 Avg. volume 1,042,024
50-day MA $263.25 Dividend yield 1.6%
200-day MA $238.80 Market Cap 52.13B

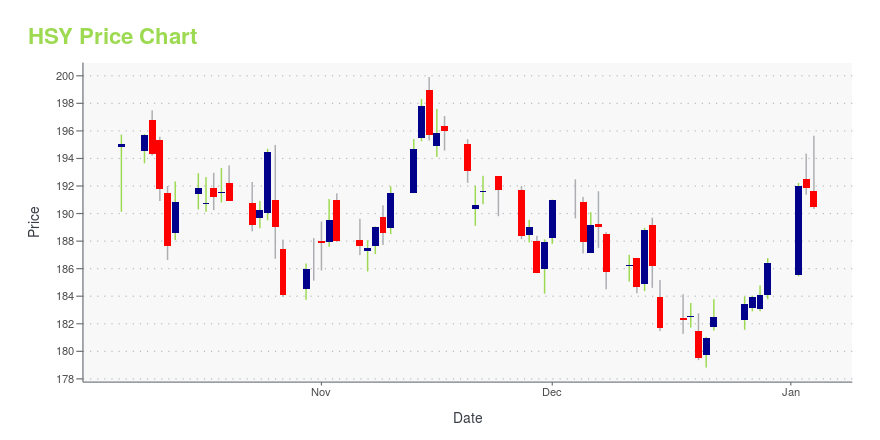
HSY Stock Price Chart Interactive Chart >

HSY POWR Grades

  • HSY scores best on the Quality dimension, with a Quality rank ahead of 96.44% of US stocks.
  • HSY's strongest trending metric is Stability; it's been moving up over the last 179 days.
  • HSY ranks lowest in Value; there it ranks in the 12th percentile.

HSY Stock Summary

  • With a market capitalization of $53,648,542,800, HERSHEY CO has a greater market value than 95.99% of US stocks.
  • With a one year PEG ratio of 1,083.82, HERSHEY CO is expected to have a higher PEG ratio (a measure of how expensive a stock is relative to its expected earnings growth) than 97.86% of US stocks.
  • HSY's went public 37.42 years ago, making it older than 93.61% of listed US stocks we're tracking.
  • Stocks that are quantitatively similar to HSY, based on their financial statements, market capitalization, and price volatility, are ECL, DG, KHC, GD, and CTAS.
  • HSY's SEC filings can be seen here. And to visit HERSHEY CO's official web site, go to www.thehersheycompany.com.

HSY Valuation Summary

  • HSY's price/sales ratio is 5; this is 177.78% higher than that of the median Consumer Defensive stock.
  • HSY's price/earnings ratio has moved up 9.8 over the prior 243 months.

Below are key valuation metrics over time for HSY.

Stock Date P/S P/B P/E EV/EBIT
HSY 2023-05-23 5.0 15.5 31.6 27.0
HSY 2023-05-22 5.0 15.5 31.6 27.1
HSY 2023-05-19 5.1 15.7 32.0 27.4
HSY 2023-05-18 5.1 15.8 32.1 27.5
HSY 2023-05-17 5.1 15.8 32.2 27.5
HSY 2023-05-16 5.1 15.9 32.4 27.7

HSY Growth Metrics

    Its 2 year price growth rate is now at 66.52%.
  • Its 2 year net income to common stockholders growth rate is now at 44.67%.
  • Its year over year net cashflow from operations growth rate is now at 3.22%.
HSY's revenue has moved up $2,412,213,000 over the prior 34 months.

The table below shows HSY's growth in key financial areas (numbers in millions of US dollars).

Date Revenue Operating Cash Flow Net Income to Common Stock
2022-12-31 10,419.29 2,327.837 1,644.817
2022-09-30 10,093.08 2,239.361 1,584.077
2022-06-30 9,724.77 2,179.005 1,629.517
2022-03-31 9,341.61 2,129.711 1,615.191
2021-12-31 8,971.337 2,082.884 1,477.512
2021-09-30 8,830.453 2,008.108 1,433.343

HSY's Quality Factors

The “Quality” component of the POWR Ratings focuses on 31 different factors of a companies fundamentals and operational strength. Here are some key insights as we drill into the specifics of these quality attributes.
  • HSY has a Quality Grade of A, ranking ahead of 95.39% of graded US stocks.
  • HSY's asset turnover comes in at 0.968 -- ranking 24th of 59 Food Products stocks.
  • K, LNDC, and LANC are the stocks whose asset turnover ratios are most correlated with HSY.

The table below shows HSY's key quality metrics over time.

Period Asset Turnover Gross Margin ROIC
2021-10-03 0.968 0.453 0.247
2021-07-04 0.957 0.462 0.255
2021-04-04 0.926 0.462 0.247
2020-12-31 0.902 0.454 0.229
2020-09-27 0.914 0.455 0.229
2020-06-28 0.925 0.442 0.216

HSY Price Target

For more insight on analysts targets of HSY, see our HSY price target page. And for a list of of all stocks sorted by upside potential based on analyst target price, see our Top Price Target page.

Average Price Target $185.05 Average Broker Recommendation 1.75 (Moderate Buy)

Hershey Co. (HSY) Company Bio


Hershey Company sells chocolate and sugar confectionery products, pantry items, such as baking ingredients, toppings, sundae syrups, and beverages, snack items, including spreads, and gum and mint refreshment products comprising chewing gums and bubble gums. The company was founded in 1894 and is based in Hershey, Pennsylvania.


HSY Latest News Stream


Event/Time News Detail
Loading, please wait...

HSY Latest Social Stream


Loading social stream, please wait...

View Full HSY Social Stream

Latest HSY News From Around the Web

Below are the latest news stories about HERSHEY CO that investors may wish to consider to help them evaluate HSY as an investment opportunity.

Here's Why Hershey (HSY) is a Strong Growth Stock

Wondering how to pick strong, market-beating stocks for your investment portfolio? Look no further than the Zacks Style Scores.

Yahoo | June 1, 2023

Is The Hershey Company (NYSE:HSY) Worth US$258 Based On Its Intrinsic Value?

Key Insights Using the 2 Stage Free Cash Flow to Equity, Hershey fair value estimate is US$191 Hershey's US$258 share...

Yahoo | May 27, 2023

Want Rising Passive Income? 2 Stocks That Have More Than Doubled Their Payouts in 10 Years

If your investment approach is like mine, here are two remarkable dividend growth stocks that you would be wise to seriously consider adding to your portfolio. From its inception, TJX Companies (NYSE: TJX) realized this and has built its business model around this fact and grown to a market capitalization of $90 billion.

Yahoo | May 26, 2023

The Hershey Company Releases 2022 ESG Report

The Hershey Company (NYSE:HSY) shared its 2022 Environmental, Social, and Governance (ESG) Report, outlining progress toward its key sustainability priorities and goals. Our Shared Goodness Promise, Hershey's global sustainability strategy, guides how the company incorporates responsible and sustainable practices into every aspect of its business to drive long-term business resilience and growth.

Yahoo | May 24, 2023

Take the Zacks Approach to Beat the Market: Shopify, Brambles, McDonald's in Focus

Our time-tested methodologies were at work to help investors navigate the market well last week. Here are some of our key performance data from the past three months.

Yahoo | May 22, 2023

Read More 'HSY' Stories Here

HSY Price Returns

1-mo -7.02%
3-mo 7.13%
6-mo 6.56%
1-year 22.75%
3-year 99.35%
5-year 210.65%
YTD 11.04%
2022 21.86%
2021 29.58%
2020 5.90%
2019 40.20%
2018 -2.92%

HSY Dividends

Ex-Dividend Date Type Payout Amount Change
Loading, please wait...
View Full HSY Dividend History

Get Free Updates

Join thousands of investors who get the latest news, insights and top rated picks from StockNews.com!