
Hercules Capital, Inc. (HTGC): Price and Financial Metrics
HTGC Price/Volume Stats
| Current price | $21.43 | 52-week high | $21.61 |
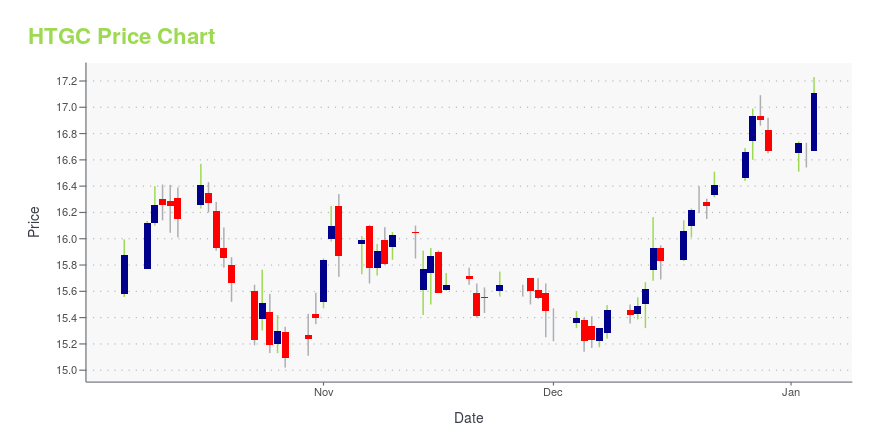
| Prev. close | $21.13 | 52-week low | $15.02 |
| Day low | $21.21 | Volume | 652,829 |
| Day high | $21.45 | Avg. volume | 895,738 |
| 50-day MA | $20.23 | Dividend yield | 7.51% |
| 200-day MA | $17.99 | Market Cap | 3.48B |
HTGC Stock Price Chart Interactive Chart >
Hercules Capital, Inc. (HTGC) Company Bio
Hercules Technology Growth Capital, Inc. is a business development company specializing in providing venture debt, debt, senior secured loans, and growth capital to privately held venture capital-backed companies at all stages of development including select publicly listed companies and select special opportunity lower middle market companies that require additional capital to fund acquisitions, recapitalizations and re-financings and established-stage companies. The company was founded in 2003 and is based in Palo Alto, California.
Latest HTGC News From Around the Web
Below are the latest news stories about HERCULES CAPITAL INC that investors may wish to consider to help them evaluate HTGC as an investment opportunity.
Hercules Capital (HTGC) Outperforms Broader Market: What You Need to KnowIn the latest trading session, Hercules Capital (HTGC) closed at $16.41, marking a +0.98% move from the previous day. |
enGene Announces Expanded $50 Million Debt Facility with Hercules CapitalenGene Holdings Inc. ("enGene," Nasdaq: ENGN), a clinical-stage genetic medicines company whose lead EG-70 program is in a pivotal study for BCG-unresponsive non-muscle invasive bladder cancer (NMIBC), announced today that it has entered into an amended USD $50 million loan agreement (the "Loan Agreement") with Hercules Capital, Inc. (NYSE: HTGC) ("Hercules"). Under the Loan Agreement, which has a term of four years, $22.5 million has been advanced to enGene under a non-revolving term loan and, |
Investors in Hercules Capital (NYSE:HTGC) have seen splendid returns of 155% over the past five yearsWhen you buy and hold a stock for the long term, you definitely want it to provide a positive return. Furthermore... |
This Dividend Stock Has Returned 157% Over the Past 10 Years. You Can Buy It Today for Just $15Hercules Technology Growth Capital makes high-yield loans to energy, life sciences, and technology businesses. |
Phathom Pharmaceuticals Announces Expansion of Existing Loan and Security Agreement with Hercules CapitalAmendment provides more favorable terms including a 14-month extension of the interest-only period and maturity date until December 2027Up to an additional $100 million in non-dilutive capital available subject to the achievement of certain revenue milestonesCash runway now expected through the end of 2026 FLORHAM PARK, N.J., Dec. 14, 2023 (GLOBE NEWSWIRE) -- Phathom Pharmaceuticals, Inc. (Nasdaq: PHAT), a biopharmaceutical company focused on developing and commercializing novel treatments for g |
HTGC Price Returns
| 1-mo | 6.35% |
| 3-mo | 15.15% |
| 6-mo | 28.34% |
| 1-year | 46.21% |
| 3-year | 75.24% |
| 5-year | 188.18% |
| YTD | 35.19% |
| 2023 | 42.91% |
| 2022 | -9.51% |
| 2021 | 25.99% |
| 2020 | 15.13% |
| 2019 | 39.86% |
HTGC Dividends
| Ex-Dividend Date | Type | Payout Amount | Change | ||||||
|---|---|---|---|---|---|---|---|---|---|
| Loading, please wait... | |||||||||
Continue Researching HTGC
Want to do more research on Hercules Capital Inc's stock and its price? Try the links below:Hercules Capital Inc (HTGC) Stock Price | Nasdaq
Hercules Capital Inc (HTGC) Stock Quote, History and News - Yahoo Finance
Hercules Capital Inc (HTGC) Stock Price and Basic Information | MarketWatch
Loading social stream, please wait...