Haverty Furniture Companies, Inc. (HVT): Price and Financial Metrics


Haverty Furniture Companies, Inc. (HVT): $31.05

0.20 (+0.65%)

POWR Rating

Component Grades

Growth

S

Value

I

Momentum

G

Stability

N

Sentiment

U

Quality

P

HVT POWR Grades

  • HVT scores best on the Quality dimension, with a Quality rank ahead of 97.5% of US stocks.
  • The strongest trend for HVT is in Growth, which has been heading up over the past 179 days.
  • HVT ranks lowest in Momentum; there it ranks in the 16th percentile.

HVT Stock Summary

  • With a one year PEG ratio of 689.61, HAVERTY FURNITURE COMPANIES INC is expected to have a higher PEG ratio (a measure of how expensive a stock is relative to its expected earnings growth) than 95.71% of US stocks.
  • Of note is the ratio of HAVERTY FURNITURE COMPANIES INC's sales and general administrative expense to its total operating expenses; 87% of US stocks have a lower such ratio.
  • Shareholder yield, a measure of how much is returned to shareholders via dividends and share repurchases, for HVT comes in at 12.73% -- higher than that of 86.2% of stocks in our set.
  • Stocks that are quantitatively similar to HVT, based on their financial statements, market capitalization, and price volatility, are PSMT, SITE, WMK, JBT, and TTSH.
  • Visit HVT's SEC page to see the company's official filings. To visit the company's web site, go to www.havertys.com.

HVT Valuation Summary

  • In comparison to the median Consumer Cyclical stock, HVT's price/sales ratio is 72.22% lower, now standing at 0.5.
  • HVT's price/sales ratio has moved up 0.2 over the prior 243 months.

Below are key valuation metrics over time for HVT.

Stock Date P/S P/B P/E EV/EBIT
HVT 2023-03-17 0.5 1.8 5.7 5.1
HVT 2023-03-16 0.5 1.8 5.8 5.1
HVT 2023-03-15 0.5 1.8 5.8 5.1
HVT 2023-03-14 0.5 1.8 5.9 5.1
HVT 2023-03-13 0.5 1.8 5.7 5.0
HVT 2023-03-10 0.5 1.8 5.8 5.1

HVT Growth Metrics

    Its 4 year revenue growth rate is now at -3.99%.
  • Its 5 year cash and equivalents growth rate is now at 31.24%.
  • The 3 year net cashflow from operations growth rate now stands at 45.48%.
HVT's revenue has moved up $230,307,000 over the prior 33 months.

The table below shows HVT's growth in key financial areas (numbers in millions of US dollars).

Date Revenue Operating Cash Flow Net Income to Common Stock
2022-09-30 1,032.598 46.444 89.926
2022-06-30 1,018.481 65.908 89.608
2022-03-31 1,015.254 98.219 90.758
2021-12-31 1,012.799 97.242 90.803
2021-09-30 988.197 119.368 91.925
2021-06-30 945.332 163.364 85.953

HVT's Quality Factors

The “Quality” component of the POWR Ratings focuses on 31 different factors of a companies fundamentals and operational strength. Here are some key insights as we drill into the specifics of these quality attributes.
  • HVT has a Quality Grade of A, ranking ahead of 98.6% of graded US stocks.
  • HVT's asset turnover comes in at 1.357 -- ranking 91st of 165 Retail stocks.
  • LL, BBBY, and ULTA are the stocks whose asset turnover ratios are most correlated with HVT.

The table below shows HVT's key quality metrics over time.

Period Asset Turnover Gross Margin ROIC
2021-09-30 1.357 0.569 0.227
2021-06-30 1.327 0.567 0.214
2021-03-31 1.176 0.564 0.190
2020-12-31 1.149 0.560 0.142
2020-09-30 1.160 0.551 0.097
2020-06-30 1.205 0.543 0.066

HVT Price Target

For more insight on analysts targets of HVT, see our HVT price target page. And for a list of of all stocks sorted by upside potential based on analyst target price, see our Top Price Target page.

Average Price Target $64.00 Average Broker Recommendation 1.5 (Moderate Buy)

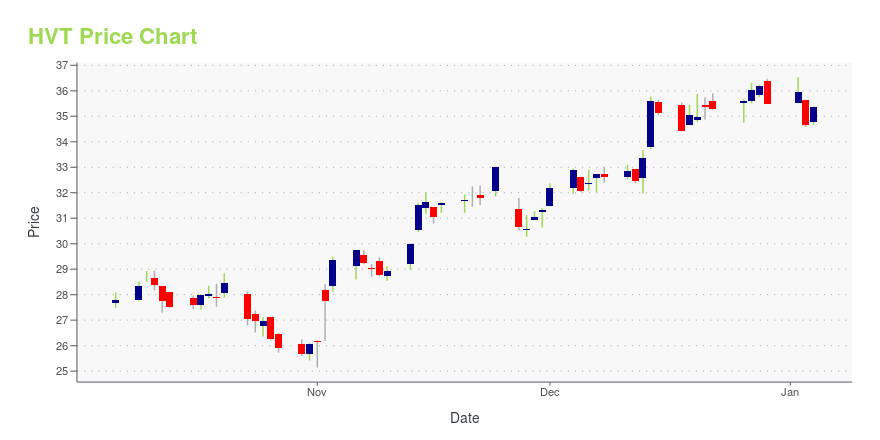
HVT Stock Price Chart Interactive Chart >

Price chart for HVT

HVT Price/Volume Stats

Current price $31.05 52-week high $38.85
Prev. close $30.85 52-week low $22.77
Day low $30.48 Volume 96,900
Day high $31.32 Avg. volume 144,316
50-day MA $34.43 Dividend yield 3.63%
200-day MA $29.64 Market Cap 501.46M

Haverty Furniture Companies, Inc. (HVT) Company Bio


Haverty Furniture operates as a specialty retailer of residential furniture and accessories in the United States. The company was founded in 1885 and is based in Atlanta, Georgia.


HVT Latest News Stream


Event/Time News Detail
Loading, please wait...

HVT Latest Social Stream


Loading social stream, please wait...

View Full HVT Social Stream

Latest HVT News From Around the Web

Below are the latest news stories about HAVERTY FURNITURE COMPANIES INC that investors may wish to consider to help them evaluate HVT as an investment opportunity.

Is Haverty Furniture Companies, Inc. (NYSE:HVT) Trading At A 42% Discount?

Key Insights Haverty Furniture Companies' estimated fair value is US$55.21 based on 2 Stage Free Cash Flow to Equity...

Yahoo | March 18, 2023

Haverty Furniture Companies, Inc. (NYSE:HVT) Looks Like A Good Stock, And It's Going Ex-Dividend Soon

Haverty Furniture Companies, Inc. ( NYSE:HVT ) is about to trade ex-dividend in the next four days. The ex-dividend...

Yahoo | March 4, 2023

Havertys Announces First Quarter Cash Dividend

February 24, 2023 / HAVERTYS (NYSE:HVT and HVT.A) announced today that its board of directors declared a cash dividend to be paid on the outstanding shares of the two classes of $1 par value common stock of the company at a rate of $0.28 per share on the common stock and $0.26 per share on the Class A common stock. The dividend is payable on March 27, 2023, to stockholders of record at the close of business on March 10, 2023.

Yahoo | February 24, 2023

Haverty Furniture Companies Full Year 2022 Earnings: EPS: US$5.53 (vs US$5.03 in FY 2021)

Haverty Furniture Companies ( NYSE:HVT ) Full Year 2022 Results Key Financial Results Revenue: US$1.05b (up 3.4% from...

Yahoo | February 23, 2023

Haverty Furniture (HVT) Lags Q4 Earnings Estimates

Haverty Furniture (HVT) delivered earnings and revenue surprises of -2.11% and 2.92%, respectively, for the quarter ended December 2022. Do the numbers hold clues to what lies ahead for the stock?

Yahoo | February 21, 2023

Read More 'HVT' Stories Here

HVT Price Returns

1-mo -17.32%
3-mo N/A
6-mo 29.98%
1-year 16.43%
3-year 207.72%
5-year 138.00%
YTD 4.72%
2022 4.83%
2021 20.52%
2020 52.54%
2019 11.52%
2018 -10.03%

HVT Dividends

Ex-Dividend Date Type Payout Amount Change
Loading, please wait...
View Full HVT Dividend History

Continue Researching HVT

Here are a few links from around the web to help you further your research on Haverty Furniture Companies Inc's stock as an investment opportunity:

Haverty Furniture Companies Inc (HVT) Stock Price | Nasdaq
Haverty Furniture Companies Inc (HVT) Stock Quote, History and News - Yahoo Finance
Haverty Furniture Companies Inc (HVT) Stock Price and Basic Information | MarketWatch

Get Free Updates

Join thousands of investors who get the latest news, insights and top rated picks from StockNews.com!


Page generated in 0.7336 seconds.