
Hancock Whitney Corporation (HWC): Price and Financial Metrics
HWC Price/Volume Stats
| Current price | $57.12 | 52-week high | $57.78 |
| Prev. close | $56.40 | 52-week low | $32.16 |
| Day low | $56.62 | Volume | 661,200 |
| Day high | $57.70 | Avg. volume | 496,102 |
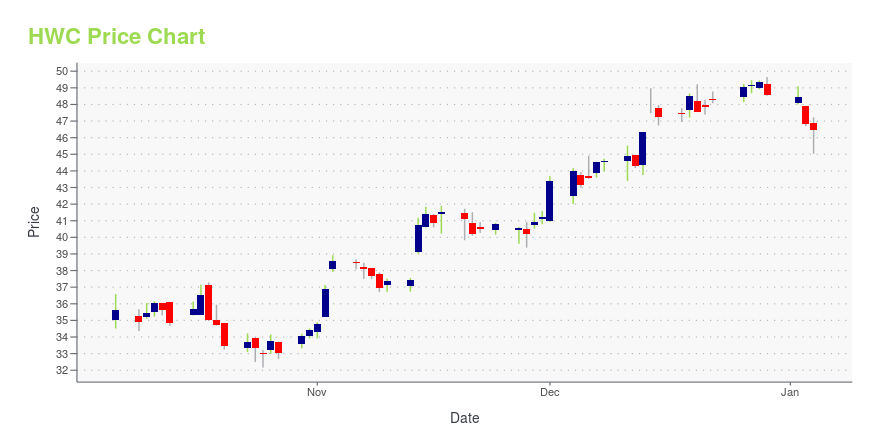
| 50-day MA | $47.97 | Dividend yield | 2.85% |
| 200-day MA | $44.35 | Market Cap | 4.95B |
HWC Stock Price Chart Interactive Chart >
Hancock Whitney Corporation (HWC) Company Bio
Hancock Whitney Corporation (formerly Hancock Holding Company) provides a range of community banking services to commercial, small business, and retail customers in the states of Mississippi, Louisiana, Texas, Florida, and Alabama. The company was founded in 1883 and is based in Gulfport, Mississippi.
Latest HWC News From Around the Web
Below are the latest news stories about HANCOCK WHITNEY CORP that investors may wish to consider to help them evaluate HWC as an investment opportunity.
Hancock Whitney Corporation to announce fourth quarter 2023 financial results and host conference call January 16GULFPORT, Miss., December 26, 2023--Hancock Whitney Corporation to announce fourth quarter 2023 financial results and host conference call January 16 |
First Community Bancshares (FCBC) Soars 5.2%: Is Further Upside Left in the Stock?First Community Bancshares (FCBC) was a big mover last session on higher-than-average trading volume. The latest trend in earnings estimate revisions might not help the stock continue moving higher in the near term. |
Following a 20% decline over last year, recent gains may please Hancock Whitney Corporation (NASDAQ:HWC) institutional ownersKey Insights Significantly high institutional ownership implies Hancock Whitney's stock price is sensitive to their... |
Hancock Whitney (HWC) Up 18.3% Since Last Earnings Report: Can It Continue?Hancock Whitney (HWC) reported earnings 30 days ago. What's next for the stock? We take a look at earnings estimates for some clues. |
Hancock Whitney Corporation Announces Quarterly DividendGULFPORT, Miss., October 26, 2023--Hancock Whitney Corporation Announces Quarterly Dividend |
HWC Price Returns
| 1-mo | 23.18% |
| 3-mo | 23.29% |
| 6-mo | 21.31% |
| 1-year | 33.54% |
| 3-year | 39.91% |
| 5-year | 59.84% |
| YTD | 19.43% |
| 2023 | 3.30% |
| 2022 | -1.23% |
| 2021 | 50.58% |
| 2020 | -19.11% |
| 2019 | 30.21% |
HWC Dividends
| Ex-Dividend Date | Type | Payout Amount | Change | ||||||
|---|---|---|---|---|---|---|---|---|---|
| Loading, please wait... | |||||||||
Continue Researching HWC
Want to see what other sources are saying about Hancock Whitney Corp's financials and stock price? Try the links below:Hancock Whitney Corp (HWC) Stock Price | Nasdaq
Hancock Whitney Corp (HWC) Stock Quote, History and News - Yahoo Finance
Hancock Whitney Corp (HWC) Stock Price and Basic Information | MarketWatch
Loading social stream, please wait...