
ICICI Bank Ltd. ADR (IBN): Price and Financial Metrics
IBN Price/Volume Stats
| Current price | $33.53 | 52-week high | $34.14 |
| Prev. close | $33.22 | 52-week low | $25.13 |
| Day low | $33.29 | Volume | 7,280,988 |
| Day high | $34.14 | Avg. volume | 4,932,496 |
| 50-day MA | $29.84 | Dividend yield | 0.63% |
| 200-day MA | $29.59 | Market Cap | 119.39B |
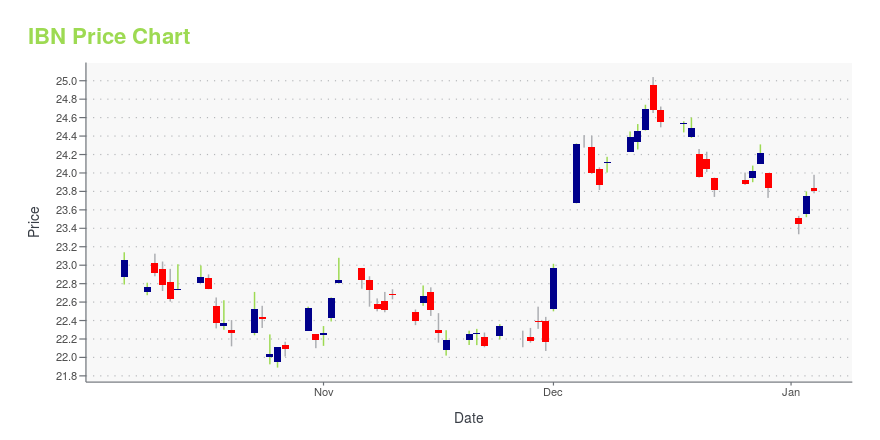
IBN Stock Price Chart Interactive Chart >
ICICI Bank Ltd. ADR (IBN) Company Bio
ICICI Bank Limited is an Indian private bank. It is headquartered at Mumbai. It offers a wide range of banking products and financial services for corporate and retail customers through a variety of delivery channels and specialized subsidiaries in the areas of investment banking, life, non-life insurance, venture capital and asset management. (Source:Wikipedia)
IBN Price Returns
| 1-mo | 7.19% |
| 3-mo | 21.40% |
| 6-mo | 13.39% |
| 1-year | 31.51% |
| 3-year | 81.23% |
| 5-year | 281.01% |
| YTD | 12.29% |
| 2024 | 26.16% |
| 2023 | 9.70% |
| 2022 | 11.20% |
| 2021 | 33.54% |
| 2020 | -1.52% |
IBN Dividends
| Ex-Dividend Date | Type | Payout Amount | Change | ||||||
|---|---|---|---|---|---|---|---|---|---|
| Loading, please wait... | |||||||||
Continue Researching IBN
Want to see what other sources are saying about Icici Bank Ltd's financials and stock price? Try the links below:Icici Bank Ltd (IBN) Stock Price | Nasdaq
Icici Bank Ltd (IBN) Stock Quote, History and News - Yahoo Finance
Icici Bank Ltd (IBN) Stock Price and Basic Information | MarketWatch
Loading social stream, please wait...