
ICICI Bank Ltd. ADR (IBN): Price and Financial Metrics
IBN Price/Volume Stats
| Current price | $28.76 | 52-week high | $29.66 |
| Prev. close | $28.30 | 52-week low | $21.89 |
| Day low | $28.64 | Volume | 4,750,450 |
| Day high | $28.86 | Avg. volume | 5,556,504 |
| 50-day MA | $27.89 | Dividend yield | 0.59% |
| 200-day MA | $25.39 | Market Cap | 101.17B |
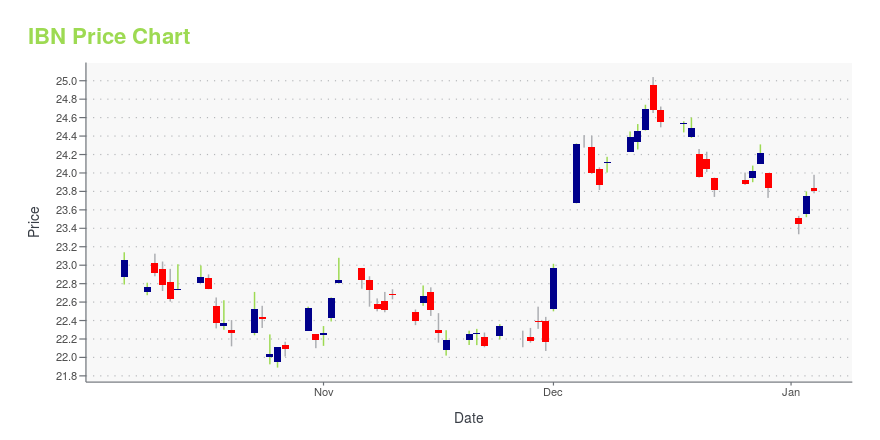
IBN Stock Price Chart Interactive Chart >
ICICI Bank Ltd. ADR (IBN) Company Bio
ICICI Bank Limited is an Indian private bank. It is headquartered at Mumbai. It offers a wide range of banking products and financial services for corporate and retail customers through a variety of delivery channels and specialized subsidiaries in the areas of investment banking, life, non-life insurance, venture capital and asset management. (Source:Wikipedia)
Latest IBN News From Around the Web
Below are the latest news stories about ICICI BANK LTD that investors may wish to consider to help them evaluate IBN as an investment opportunity.
Zacks Investment Ideas feature highlights: Tesla, iShares MSCI India ETF, MakeMyTrip, Infosys and ICICI BankTesla, iShares MSCI India ETF, MakeMyTrip, Infosys and ICICI Bank have been highlighted in this Investment Ideas article. |
12 Asian Countries with the Best Quality of LifeIn this article, we will look into the 12 Asian countries with the best quality of life. If you want to skip our detailed analysis, you can go directly to the 5 Asian Countries with the Best Quality of Life. Quality of Life in Asia Asia is a diverse region with some of its countries […] |
Zacks Industry Outlook Highlights Mitsubishi UFJ Financial, ICICI Bank and UBS GroupMitsubishi UFJ Financial, ICICI Bank and UBS Group are part of the Zacks Industry Outlook article. |
Higher Rates to Aid HSBC's Q3 Earnings, IB &Trading to HurtBecause of subdued market volatility and lower client activity, HSBC is expected to have recorded a decline in trading revenues in the third quarter of 2023. |
ICICI Bank (IBN) Stock Gains as Q2 Earnings Rise on Higher NIIRise in loan balance, higher NII and non-interest income, and improving credit quality support ICICI Bank's (IBN) fiscal Q2 earnings. |
IBN Price Returns
| 1-mo | -0.48% |
| 3-mo | 8.41% |
| 6-mo | 19.19% |
| 1-year | 19.86% |
| 3-year | 60.71% |
| 5-year | 146.22% |
| YTD | 20.64% |
| 2023 | 9.70% |
| 2022 | 11.20% |
| 2021 | 33.54% |
| 2020 | -1.52% |
| 2019 | 47.00% |
IBN Dividends
| Ex-Dividend Date | Type | Payout Amount | Change | ||||||
|---|---|---|---|---|---|---|---|---|---|
| Loading, please wait... | |||||||||
Continue Researching IBN
Want to see what other sources are saying about Icici Bank Ltd's financials and stock price? Try the links below:Icici Bank Ltd (IBN) Stock Price | Nasdaq
Icici Bank Ltd (IBN) Stock Quote, History and News - Yahoo Finance
Icici Bank Ltd (IBN) Stock Price and Basic Information | MarketWatch
Loading social stream, please wait...