
International Flavors & Fragrances Inc. (IFF): Price and Financial Metrics
IFF Price/Volume Stats
| Current price | $98.84 | 52-week high | $99.91 |
| Prev. close | $97.16 | 52-week low | $62.11 |
| Day low | $97.27 | Volume | 1,231,311 |
| Day high | $99.01 | Avg. volume | 1,854,695 |
| 50-day MA | $96.58 | Dividend yield | 1.62% |
| 200-day MA | $83.42 | Market Cap | 25.24B |
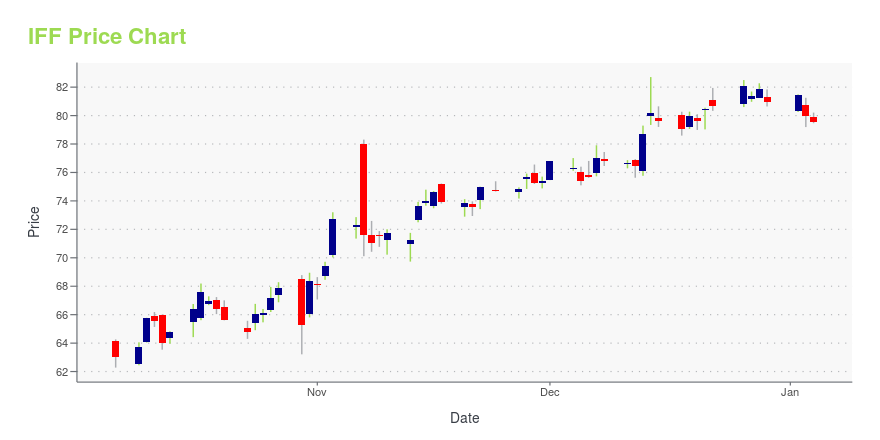
IFF Stock Price Chart Interactive Chart >
International Flavors & Fragrances Inc. (IFF) Company Bio
International Flavors & Fragrances is an American corporation that creates and manufactures food, beverage, health & biosciences, scent and pharma solutions and complementary adjacent products, including cosmetic active and natural health ingredients, which are used in a wide variety of consumer products. It is headquartered in New York City and has creative, sales, and manufacturing facilities in 45 different countries. The company is a member of the S&P 500 Index. (Source:Wikipedia)
Latest IFF News From Around the Web
Below are the latest news stories about INTERNATIONAL FLAVORS & FRAGRANCES INC that investors may wish to consider to help them evaluate IFF as an investment opportunity.
International Flavors & Fragrances Inc's Dividend AnalysisAs investors look forward to this upcoming payment, the spotlight also shines on the company's dividend history, yield, and growth rates. Using the data from GuruFocus, let's look into International Flavors & Fragrances Inc's dividend performance and assess its sustainability. What Does International Flavors & Fragrances Inc Do? |
International Flavors (IFF) Expands Collaboration With KemiraInternational Flavors (IFF) and Kemira are set to commercialize newly designed enzymatic biomaterials. |
IFF Expands Partnership with Kemira to Commercialize New Designed Enzymatic BiomaterialsIFF (NYSE:IFF) and Kemira today announced their next step in the collaboration to commercialize a portfolio of unique, renewable polymers derived from IFF's cutting-edge Designed Enzymatic Biomaterials (DEB) technology platform. These unique, renewable polymers derived from plant sugars will be available for the first time at industrial scale to supply a range of markets. This new market development biomanufacturing facility will be integrated into Chemigate Ltd's biorefinery, a member of the Be |
LMR Naturals by IFF Wins CosmetiqueMag Gold Award for Innovative Neroli Essential ExtractIFF today announced that LMR Naturals by IFF (LMR) has been honored with the prestigious CosmetiqueMag Gold Award in the ingredient category for its groundbreaking Neroli Essential Extract. This accolade is a testament to the Company's commitment to sustainability and innovation within the beauty industry. |
What International Flavors & Fragrances Inc.'s (NYSE:IFF) P/S Is Not Telling YouWith a median price-to-sales (or "P/S") ratio of close to 1.4x in the Chemicals industry in the United States, you... |
IFF Price Returns
| 1-mo | 2.75% |
| 3-mo | 17.31% |
| 6-mo | 21.24% |
| 1-year | 21.08% |
| 3-year | -27.39% |
| 5-year | -22.19% |
| YTD | 23.17% |
| 2023 | -19.47% |
| 2022 | -28.35% |
| 2021 | 41.55% |
| 2020 | -13.34% |
| 2019 | -1.70% |
IFF Dividends
| Ex-Dividend Date | Type | Payout Amount | Change | ||||||
|---|---|---|---|---|---|---|---|---|---|
| Loading, please wait... | |||||||||
Continue Researching IFF
Want to do more research on International Flavors & Fragrances Inc's stock and its price? Try the links below:International Flavors & Fragrances Inc (IFF) Stock Price | Nasdaq
International Flavors & Fragrances Inc (IFF) Stock Quote, History and News - Yahoo Finance
International Flavors & Fragrances Inc (IFF) Stock Price and Basic Information | MarketWatch
Loading social stream, please wait...