Intel Corporation (INTC): Price and Financial Metrics
INTC Price/Volume Stats
Current price | $31.44 | 52-week high | $44.93 |
Prev. close | $29.99 | 52-week low | $24.59 |
Day low | $29.67 | Volume | 136,243,700 |
Day high | $32.29 | Avg. volume | 44,775,086 |
50-day MA | $30.46 | Dividend yield | 1.72% |
200-day MA | $29.08 | Market Cap | 131.14B |
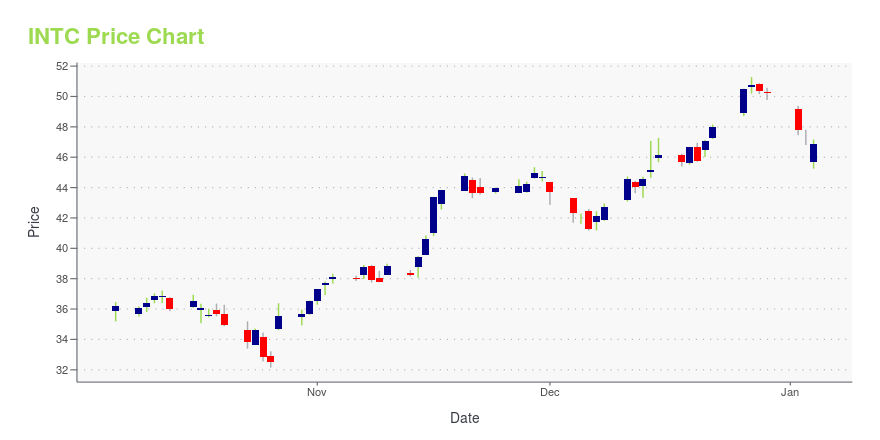
INTC Stock Price Chart Interactive Chart >
INTC POWR Grades
- INTC scores best on the Momentum dimension, with a Momentum rank ahead of 84.47% of US stocks.
- The strongest trend for INTC is in Momentum, which has been heading up over the past 179 days.
- INTC ranks lowest in Growth; there it ranks in the 4th percentile.
INTC Stock Summary
- INTC has a higher market value than 98.48% of US stocks; more precisely, its current market capitalization is $120,959,000,000.
- INTEL CORP's stock had its IPO on January 1, 1986, making it an older stock than 93.61% of US equities in our set.
- Revenue growth over the past 12 months for INTEL CORP comes in at -27.4%, a number that bests only 8.34% of the US stocks we're tracking.
- Stocks with similar financial metrics, market capitalization, and price volatility to INTEL CORP are AMAT, VRTX, LRCX, REGN, and MU.
- Visit INTC's SEC page to see the company's official filings. To visit the company's web site, go to www.intel.com.
INTC Valuation Summary
- In comparison to the median Technology stock, INTC's EV/EBIT ratio is 337.35% lower, now standing at -50.2.
- INTC's price/earnings ratio has moved down 85.9 over the prior 243 months.
Below are key valuation metrics over time for INTC.
Stock | Date | P/S | P/B | P/E | EV/EBIT |
---|---|---|---|---|---|
INTC | 2023-05-22 | 2.2 | 1.3 | -44.2 | -50.2 |
INTC | 2023-05-19 | 2.2 | 1.3 | -43.7 | -49.8 |
INTC | 2023-05-18 | 2.2 | 1.3 | -43.3 | -49.4 |
INTC | 2023-05-17 | 2.1 | 1.2 | -42.1 | -48.4 |
INTC | 2023-05-16 | 2.2 | 1.2 | -42.7 | -48.9 |
INTC | 2023-05-15 | 2.2 | 1.3 | -43.5 | -49.6 |
INTC Growth Metrics
- Its 3 year cash and equivalents growth rate is now at 97.05%.
- Its 2 year price growth rate is now at -26.44%.
- Its 2 year net cashflow from operations growth rate is now at -11.68%.

The table below shows INTC's growth in key financial areas (numbers in millions of US dollars).
Date | Revenue | Operating Cash Flow | Net Income to Common Stock |
---|---|---|---|
2022-12-31 | 63,054 | 15,433 | 8,014 |
2022-09-30 | 69,540 | 13,527 | 13,301 |
2022-06-30 | 73,394 | 22,397 | 19,105 |
2022-03-31 | 77,704 | 30,334 | 24,620 |
2021-12-31 | 79,024 | 29,991 | 19,868 |
2021-09-30 | 78,474 | 34,084 | 21,102 |
INTC's Quality Factors
The “Quality” component of the POWR Ratings focuses on 31 different factors of a companies fundamentals and operational strength. Here are some key insights as we drill into the specifics of these quality attributes.- INTC has a Quality Grade of B, ranking ahead of 92.86% of graded US stocks.
- INTC's asset turnover comes in at 0.501 -- ranking 141st of 208 Electronic Equipment stocks.
- POLY, ADTN, and MTSI are the stocks whose asset turnover ratios are most correlated with INTC.
The table below shows INTC's key quality metrics over time.
Period | Asset Turnover | Gross Margin | ROIC |
---|---|---|---|
2021-09-25 | 0.501 | 0.563 | 0.193 |
2021-06-26 | 0.514 | 0.556 | 0.185 |
2021-03-27 | 0.517 | 0.546 | 0.187 |
2020-12-26 | 0.520 | 0.560 | 0.213 |
2020-09-26 | 0.537 | 0.565 | 0.221 |
2020-06-27 | 0.554 | 0.579 | 0.247 |
INTC Price Target
For more insight on analysts targets of INTC, see our INTC price target page. And for a list of of all stocks sorted by upside potential based on analyst target price, see our Top Price Target page.
Average Price Target | $62.31 | Average Broker Recommendation | 1.95 (Hold) |
Intel Corporation (INTC) Company Bio
Intel Corporation designs, manufactures, and sells integrated digital technology platforms worldwide. It operates through PC Client Group, Data Center Group, Internet of Things Group, Mobile and Communications Group, Software and Services, and All Other segments. The company was founded in 1968 and is based in Santa Clara, California.
Latest INTC News From Around the Web
Below are the latest news stories about INTEL CORP that investors may wish to consider to help them evaluate INTC as an investment opportunity.
Is This Pension Fund Giving Up on NIO Stock?Nio continues to grow and innovate. |
The 3 Quantum Computing Stocks You Need to Own Now for Maximum ReturnsFinding the best quantum computing stocks to buy is critical because this is clearly the next big industry. |
Billionaire Ken Griffin’s 2023 Portfolio: Top 15 Stock PicksIn this piece, we will take a look at the top fifteen stocks in billionaire Ken Griffin’s 2023 portfolio. For more stocks, head on over to Billionaire Ken Griffin’s 2023 Portfolio: Top 5 Stock Picks. The stock market crash of 2022 hammered several major hedge funds. One of the biggest funds that bled capital last […] |
Dow Jones Today: Nike Trips Up IndexComing off a positive week, the Dow Jones Industrial Average dropped 0.4%, or 140 points, as investors continued to wait for developments in the U.S. debt ceiling negotiations. |
10 Biggest Tech Hardware CompaniesWith Apple leading the pack, these are the 10 biggest tech hardware companies by 12-month trailing revenue. |
INTC Price Returns
1-mo | 4.19% |
3-mo | 20.49% |
6-mo | 8.65% |
1-year | -26.36% |
3-year | -45.09% |
5-year | -36.51% |
YTD | 20.90% |
2022 | -46.64% |
2021 | 6.03% |
2020 | -14.69% |
2019 | 30.71% |
2018 | 4.23% |
INTC Dividends
Ex-Dividend Date | Type | Payout Amount | Change | ||||||
---|---|---|---|---|---|---|---|---|---|
Loading, please wait... |
Continue Researching INTC
Want to see what other sources are saying about Intel Corp's financials and stock price? Try the links below:Intel Corp (INTC) Stock Price | Nasdaq
Intel Corp (INTC) Stock Quote, History and News - Yahoo Finance
Intel Corp (INTC) Stock Price and Basic Information | MarketWatch
Loading social stream, please wait...