
IF Bancorp, Inc. (IROQ): Price and Financial Metrics
IROQ Price/Volume Stats
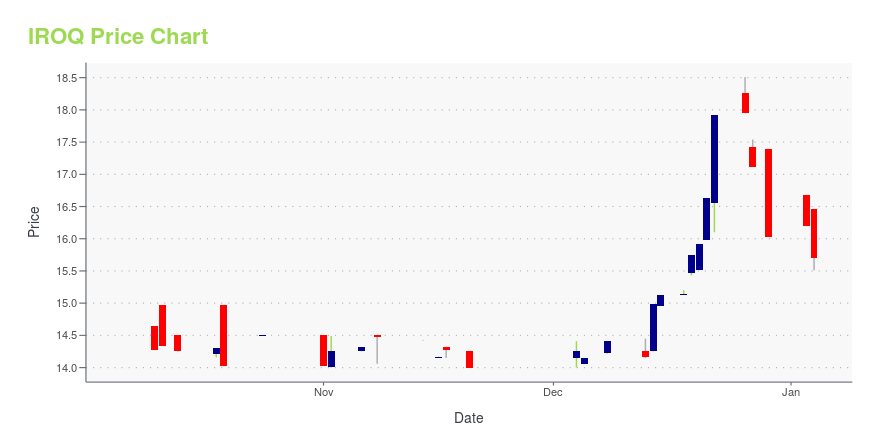
| Current price | $17.21 | 52-week high | $18.51 |
| Prev. close | $17.30 | 52-week low | $14.00 |
| Day low | $17.16 | Volume | 3,268 |
| Day high | $17.31 | Avg. volume | 2,211 |
| 50-day MA | $16.66 | Dividend yield | 2.36% |
| 200-day MA | $15.70 | Market Cap | 57.71M |
IROQ Stock Price Chart Interactive Chart >
IF Bancorp, Inc. (IROQ) Company Bio
IF Bancorp, Inc. operates as the savings and loan holding company for Iroquois Federal Savings and Loan Association that provides a range of banking and financial services to individual and corporate clients. The company offers various deposit accounts, including savings accounts, certificates of deposit, money market accounts, commercial and personal checking accounts, individual retirement accounts, and health savings accounts. It also provides loans comprising one- to four-family residential mortgage loans; multi-family mortgage loans; commercial real estate loans, such as farm loans; home equity lines of credit; commercial business loans; and consumer loans primarily consisting of automobile loans, as well as construction loans and land development loans. In addition, the company sells property and casualty insurance, as well as offers annuities; mutual funds; individual and group retirement plans; life, disability, and health insurance; individual securities; managed accounts; and other financial services. Further, it invests in securities; and provides ATM, online banking and bill pay, mobile banking, ACH origination, remote deposit capture, and telephone banking services. As of September 13, 2019, it operated a network of seven full-service banking offices located in Watseka, Danville, Clifton, Hoopeston, Savoy, Champaign, and Bourbonnais, Illinois; and a loan production and wealth management office in Osage Beach, Missouri. IF Bancorp, Inc. was founded in 1883 and is headquartered in Watseka, Illinois.
Latest IROQ News From Around the Web
Below are the latest news stories about IF BANCORP INC that investors may wish to consider to help them evaluate IROQ as an investment opportunity.
3 Underperforming Bank Stocks You Better Not Be Buyingunderstand the risks of underperforming bank stocks in amidst the uncertainty in the market at this time offering little upside |
It Looks Like IF Bancorp, Inc.'s (NASDAQ:IROQ) CEO May Expect Their Salary To Be Put Under The MicroscopeKey Insights IF Bancorp's Annual General Meeting to take place on 20th of November CEO Chip Hasselbring's total... |
IF Bancorp Inc (IROQ) Reports Q1 2024 Earnings: Net Income Drops to $466,000First Quarter of Fiscal Year 2024 (Unaudited) Earnings Report Summary |
IF Bancorp, Inc. Announces Results for First Quarter of Fiscal Year 2024 (Unaudited)WATSEKA, Ill., October 30, 2023--IF BANCORP, INC. ANNOUNCES RESULTS FOR QUARTER ENDING 9-30-23 |
Is It Smart To Buy IF Bancorp, Inc. (NASDAQ:IROQ) Before It Goes Ex-Dividend?IF Bancorp, Inc. ( NASDAQ:IROQ ) is about to trade ex-dividend in the next four days. Typically, the ex-dividend date... |
IROQ Price Returns
| 1-mo | 7.56% |
| 3-mo | 4.97% |
| 6-mo | 1.81% |
| 1-year | N/A |
| 3-year | -18.54% |
| 5-year | -12.57% |
| YTD | 8.67% |
| 2023 | -4.61% |
| 2022 | -32.39% |
| 2021 | 19.78% |
| 2020 | -2.49% |
| 2019 | 15.88% |
IROQ Dividends
| Ex-Dividend Date | Type | Payout Amount | Change | ||||||
|---|---|---|---|---|---|---|---|---|---|
| Loading, please wait... | |||||||||
Continue Researching IROQ
Here are a few links from around the web to help you further your research on IF Bancorp Inc's stock as an investment opportunity:IF Bancorp Inc (IROQ) Stock Price | Nasdaq
IF Bancorp Inc (IROQ) Stock Quote, History and News - Yahoo Finance
IF Bancorp Inc (IROQ) Stock Price and Basic Information | MarketWatch
Loading social stream, please wait...