ITT Inc. (ITT): Price and Financial Metrics
GET POWR RATINGS... FREE!
ITT POWR Grades
- ITT scores best on the Quality dimension, with a Quality rank ahead of 82.25% of US stocks.
- ITT's strongest trending metric is Growth; it's been moving up over the last 179 days.
- ITT's current lowest rank is in the Value metric (where it is better than 63.63% of US stocks).
ITT Stock Summary
- ITT has a higher market value than 80.56% of US stocks; more precisely, its current market capitalization is $6,789,670,000.
- The price/operating cash flow metric for ITT INC is higher than 79.76% of stocks in our set with a positive cash flow.
- With a year-over-year growth in debt of 128.24%, ITT INC's debt growth rate surpasses 90.06% of about US stocks.
- Stocks with similar financial metrics, market capitalization, and price volatility to ITT INC are WTT, NBRV, NSSC, LOGI, and CTS.
- Visit ITT's SEC page to see the company's official filings. To visit the company's web site, go to www.itt.com.
ITT Valuation Summary
- In comparison to the median Industrials stock, ITT's EV/EBIT ratio is 10.9% lower, now standing at 13.9.
- ITT's price/sales ratio has moved up 1.2 over the prior 243 months.
Below are key valuation metrics over time for ITT.
Stock | Date | P/S | P/B | P/E | EV/EBIT |
---|---|---|---|---|---|
ITT | 2023-03-17 | 2.2 | 2.9 | 17.8 | 13.9 |
ITT | 2023-03-16 | 2.3 | 3.0 | 18.5 | 14.4 |
ITT | 2023-03-15 | 2.2 | 2.9 | 18.0 | 14.0 |
ITT | 2023-03-14 | 2.4 | 3.2 | 19.4 | 15.1 |
ITT | 2023-03-13 | 2.3 | 3.1 | 19.1 | 14.8 |
ITT | 2023-03-10 | 2.4 | 3.2 | 19.5 | 15.2 |
ITT Growth Metrics
- Its 3 year cash and equivalents growth rate is now at 28.23%.
- Its year over year net cashflow from operations growth rate is now at -118.07%.
- Its 3 year net income to common stockholders growth rate is now at 0.36%.

The table below shows ITT's growth in key financial areas (numbers in millions of US dollars).
Date | Revenue | Operating Cash Flow | Net Income to Common Stock |
---|---|---|---|
2022-12-31 | 2,987.7 | 277.7 | 367 |
2022-09-30 | 2,898.5 | 234.7 | 355.4 |
2022-06-30 | 2,834.5 | 277.4 | 340.5 |
2022-03-31 | 2,792.8 | -81.9 | 304.9 |
2021-12-31 | 2,765 | -8.4 | 316.3 |
2021-09-30 | 2,788.2 | -10.1 | 199.2 |
ITT's Quality Factors
The “Quality” component of the POWR Ratings focuses on 31 different factors of a companies fundamentals and operational strength. Here are some key insights as we drill into the specifics of these quality attributes.- ITT has a Quality Grade of C, ranking ahead of 61.53% of graded US stocks.
- ITT's asset turnover comes in at 0.725 -- ranking 49th of 104 Machinery stocks.
- NDSN, CVR, and WBT are the stocks whose asset turnover ratios are most correlated with ITT.
The table below shows ITT's key quality metrics over time.
Period | Asset Turnover | Gross Margin | ROIC |
---|---|---|---|
2021-10-02 | 0.725 | 0.321 | 0.303 |
2021-07-03 | 0.668 | 0.321 | 0.169 |
2021-03-31 | 0.599 | 0.319 | 0.055 |
2020-12-31 | 0.587 | 0.316 | 0.054 |
2020-09-30 | 0.596 | 0.318 | 0.093 |
2020-06-30 | 0.629 | 0.319 | 0.222 |
ITT Price Target
For more insight on analysts targets of ITT, see our ITT price target page. And for a list of of all stocks sorted by upside potential based on analyst target price, see our Top Price Target page.
Average Price Target | $110.00 | Average Broker Recommendation | 1.46 (Moderate Buy) |
ITT Stock Price Chart Interactive Chart >
ITT Price/Volume Stats
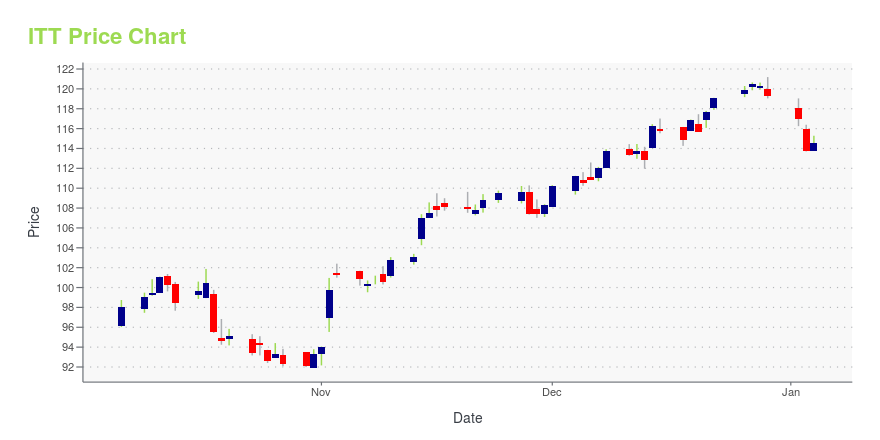
Current price | $80.69 | 52-week high | $95.18 |
Prev. close | $81.13 | 52-week low | $63.77 |
Day low | $79.00 | Volume | 636,400 |
Day high | $80.75 | Avg. volume | 531,025 |
50-day MA | $88.86 | Dividend yield | 1.43% |
200-day MA | $78.36 | Market Cap | 6.67B |
ITT Inc. (ITT) Company Bio
ITT Corporation manufactures and sells engineered critical components and customized technology solutions for the energy, transportation, and industrial markets worldwide. The company operates in four segments: Industrial Process, Motion Technologies, Interconnect Solutions, and Control Technologies. The company was founded in 1920 and is based in White Plains, New York.
Latest ITT News From Around the Web
Below are the latest news stories about ITT INC that investors may wish to consider to help them evaluate ITT as an investment opportunity.
ITT Signs 10-Year Strategic Agreement With Continental AGPer the 10-year strategic agreement with Continental, ITT will produce ATE premium line brake pads for cars and light commercial vehicles. |
ITT's (NYSE:ITT) three-year total shareholder returns outpace the underlying earnings growthITT Inc. ( NYSE:ITT ) shareholders have seen the share price descend 13% over the month. But that doesn't undermine the... |
ITT And Continental enter into a 10-year strategic aftermarket agreement, accretive to revenue
|
ITT And Continental AG Sign 10-Year Strategic Aftermarket AgreementSTAMFORD, Conn., March 20, 2023--ITT Inc. today announced the company has signed a 10-year strategic aftermarket agreement with Continental AG, a leading global automotive supplier. |
Is It Smart To Buy ITT Inc. (NYSE:ITT) Before It Goes Ex-Dividend?ITT Inc. ( NYSE:ITT ) stock is about to trade ex-dividend in 4 days. The ex-dividend date occurs one day before the... |
ITT Price Returns
1-mo | -9.87% |
3-mo | N/A |
6-mo | 22.63% |
1-year | 5.21% |
3-year | 80.13% |
5-year | 76.88% |
YTD | -0.19% |
2022 | -19.50% |
2021 | 33.95% |
2020 | 5.47% |
2019 | 54.60% |
2018 | -8.66% |
ITT Dividends
Ex-Dividend Date | Type | Payout Amount | Change | ||||||
---|---|---|---|---|---|---|---|---|---|
Loading, please wait... |
Continue Researching ITT
Here are a few links from around the web to help you further your research on ITT Inc's stock as an investment opportunity:ITT Inc (ITT) Stock Price | Nasdaq
ITT Inc (ITT) Stock Quote, History and News - Yahoo Finance
ITT Inc (ITT) Stock Price and Basic Information | MarketWatch
Loading social stream, please wait...