Invesco Ltd (IVZ): Price and Financial Metrics
GET POWR RATINGS... FREE!
IVZ POWR Grades
- Value is the dimension where IVZ ranks best; there it ranks ahead of 83.33% of US stocks.
- IVZ's strongest trending metric is Growth; it's been moving down over the last 179 days.
- IVZ ranks lowest in Sentiment; there it ranks in the 19th percentile.
IVZ Stock Summary
- IVZ has a higher market value than 81.9% of US stocks; more precisely, its current market capitalization is $10,753,919,844.
- Of note is the ratio of Invesco Ltd's sales and general administrative expense to its total operating expenses; 95.82% of US stocks have a lower such ratio.
- In terms of twelve month growth in earnings before interest and taxes, Invesco Ltd is reporting a growth rate of 120.47%; that's higher than 83.25% of US stocks.
- Stocks with similar financial metrics, market capitalization, and price volatility to Invesco Ltd are PHM, CNXC, NDSN, BEN, and HSIC.
- Visit IVZ's SEC page to see the company's official filings. To visit the company's web site, go to www.invesco.com.
IVZ Valuation Summary
- IVZ's price/sales ratio is 1.7; this is 46.88% lower than that of the median Financial Services stock.
- IVZ's price/earnings ratio has moved down 16.2 over the prior 243 months.
- IVZ's price/sales ratio has moved down 0.6 over the prior 243 months.
Below are key valuation metrics over time for IVZ.
Stock | Date | P/S | P/B | P/E | EV/EBIT |
---|---|---|---|---|---|
IVZ | 2020-03-13 | 0.8 | 0.4 | 11.1 | 12.3 |
IVZ | 2016-06-08 | 2.5 | 1.6 | 14.2 | 10.8 |
IVZ | 2014-08-22 | 3.5 | 2.0 | 17.7 | 14.2 |
IVZ | 2013-12-06 | 3.5 | 1.8 | 19.4 | 14.9 |
IVZ | 2006-10-05 | 4.2 | 2.5 | 43.3 | 21.8 |
IVZ | 2002-04-17 | 2.0 | 0.8 | 25.7 | 17.0 |
IVZ Growth Metrics
- Its 3 year revenue growth rate is now at 3.87%.
- Its 2 year price growth rate is now at -75.75%.
- Its 5 year net cashflow from operations growth rate is now at 11.43%.

The table below shows IVZ's growth in key financial areas (numbers in millions of US dollars).
Date | Revenue | Operating Cash Flow | Net Income to Common Stock |
---|---|---|---|
2021-12-31 | 6,894.5 | 1,078.1 | 1,156.2 |
2021-09-30 | 6,761.2 | 1,649.4 | 940.5 |
2021-06-30 | 6,508.8 | 1,450.2 | 802.1 |
2021-03-31 | 6,206.4 | 1,280.4 | 474.3 |
2020-12-31 | 6,145.6 | 1,230.3 | 288 |
2020-09-30 | 6,258.3 | 1,126.3 | 256.7 |
IVZ's Quality Factors
The “Quality” component of the POWR Ratings focuses on 31 different factors of a companies fundamentals and operational strength. Here are some key insights as we drill into the specifics of these quality attributes.- IVZ has a Quality Grade of D, ranking ahead of 14.03% of graded US stocks.
- IVZ's asset turnover comes in at 0.197 -- ranking 95th of 442 Trading stocks.
- DHIL, SUNS, and AB are the stocks whose asset turnover ratios are most correlated with IVZ.
The table below shows IVZ's key quality metrics over time.
Period | Asset Turnover | Gross Margin | ROIC |
---|---|---|---|
2021-09-30 | 0.197 | 1 | 0.069 |
2021-06-30 | 0.185 | 1 | 0.060 |
2021-03-31 | 0.174 | 1 | 0.042 |
2020-12-31 | 0.169 | 1 | 0.033 |
2020-09-30 | 0.169 | 1 | 0.032 |
2020-06-30 | 0.173 | 1 | 0.030 |
IVZ Price Target
For more insight on analysts targets of IVZ, see our IVZ price target page. And for a list of of all stocks sorted by upside potential based on analyst target price, see our Top Price Target page.
Average Price Target | $30.75 | Average Broker Recommendation | 1.71 (Moderate Buy) |
IVZ Stock Price Chart Interactive Chart >
IVZ Price/Volume Stats
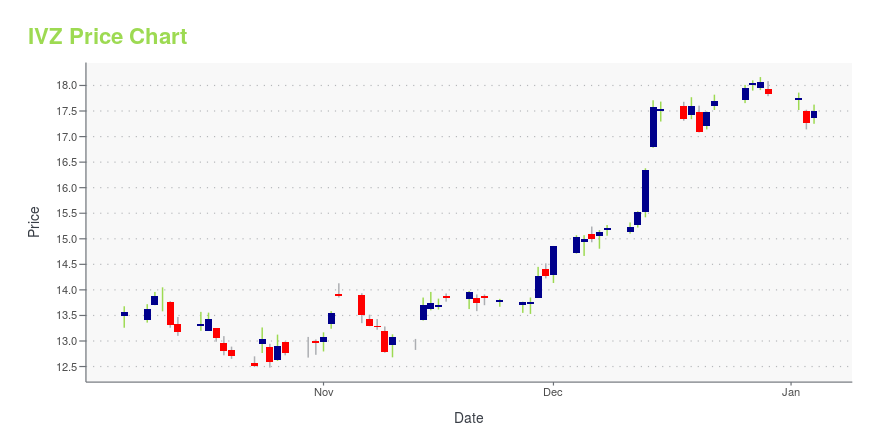
Current price | $16.22 | 52-week high | $27.03 |
Prev. close | $16.13 | 52-week low | $15.62 |
Day low | $15.91 | Volume | 1,433,671 |
Day high | $16.42 | Avg. volume | 4,643,695 |
50-day MA | $18.12 | Dividend yield | 4.65% |
200-day MA | $21.97 | Market Cap | 7.38B |
Invesco Ltd (IVZ) Company Bio
Invesco Ltd. provides its services to retail clients, institutional clients, high-net worth clients, public entities, corporations, unions, non-profit organizations, endowments, foundations, pension funds, financial institutions, and sovereign wealth funds. It also manages separate client focused equity, balanced, and fixed income portfolios. The company was founded in December 1935 and is based in Atlanta, Georgia.
Latest IVZ News From Around the Web
Below are the latest news stories about Invesco Ltd that investors may wish to consider to help them evaluate IVZ as an investment opportunity.
5 ETFs at the Forefront of Wall Street's Epic TurnaroundWall Street showed a heroic turnaround on Feb 24, shaking off the impact of the escalation in Russia-Ukraine tensions. |
5 Low-Beta ETFs to Buy Amid Market VolatilityAmid rising geopolitical tensions, investors may want to remain invested in the equity world but at the same time seek protection from a downside. |
Is Invesco S&P 500 Equal Weight Utilities ETF (RYU) a Strong ETF Right Now?Smart Beta ETF report for RYU |
Invesco DB Agriculture Fund (DBA) at a 52-Week HighThe Invesco DB Agriculture Fund (DBA) scales a new 52-week high. Are more gains in store? |
Invesco (IVZ) Down 0.7% Since Last Earnings Report: Can It Rebound?Invesco (IVZ) reported earnings 30 days ago. What's next for the stock? We take a look at earnings estimates for some clues. |
IVZ Price Returns
1-mo | -14.94% |
3-mo | -29.70% |
6-mo | -28.28% |
1-year | -37.92% |
3-year | -9.03% |
5-year | -41.69% |
YTD | -28.28% |
2021 | 35.56% |
2020 | 3.06% |
2019 | 14.91% |
2018 | -52.05% |
2017 | 24.67% |
IVZ Dividends
Ex-Dividend Date | Type | Payout Amount | Change | ||||||
---|---|---|---|---|---|---|---|---|---|
Loading, please wait... |
Continue Researching IVZ
Want to do more research on Invesco Ltd's stock and its price? Try the links below:Invesco Ltd (IVZ) Stock Price | Nasdaq
Invesco Ltd (IVZ) Stock Quote, History and News - Yahoo Finance
Invesco Ltd (IVZ) Stock Price and Basic Information | MarketWatch
Loading social stream, please wait...