
Jacobs Engineering Group Inc. (J): Price and Financial Metrics
J Price/Volume Stats
| Current price | $125.89 | 52-week high | $150.54 |
| Prev. close | $127.61 | 52-week low | $106.23 |
| Day low | $125.56 | Volume | 496,900 |
| Day high | $127.81 | Avg. volume | 871,625 |
| 50-day MA | $122.93 | Dividend yield | 1% |
| 200-day MA | $130.25 | Market Cap | 15.13B |
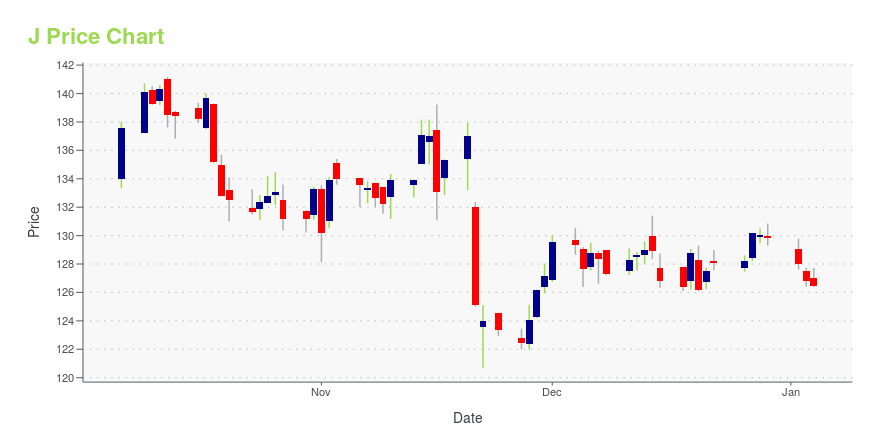
J Stock Price Chart Interactive Chart >
Jacobs Engineering Group Inc. (J) Company Bio
Jacobs Engineering Group Inc. (NYSE: J) is an American international technical professional services firm. The company provides engineering, technical, professional and construction services, as well as scientific and specialty consulting for a broad range of clients globally, including companies, organizations, and government agencies. Jacobs has consistently ranked No. 1 on both Engineering News-Record (ENR)'s 2018, 2019, 2020 & 2021 Top 500 Design Firms and Trenchless Technology’s 2018, 2019, 2020 & 2021 Top 50 Trenchless Engineering Firms. Its worldwide annual revenue reached over $14 billion in the 2021 fiscal year, and earnings rose to over 163 million. (Source:Wikipedia)
J Price Returns
| 1-mo | -2.29% |
| 3-mo | 2.80% |
| 6-mo | -6.05% |
| 1-year | 10.30% |
| 3-year | 30.06% |
| 5-year | 84.67% |
| YTD | -5.31% |
| 2024 | 24.54% |
| 2023 | 9.02% |
| 2022 | -13.12% |
| 2021 | 28.60% |
| 2020 | 22.36% |
J Dividends
| Ex-Dividend Date | Type | Payout Amount | Change | ||||||
|---|---|---|---|---|---|---|---|---|---|
| Loading, please wait... | |||||||||
Loading social stream, please wait...