
Jacobs Engineering Group Inc. (J): Price and Financial Metrics
J Price/Volume Stats
| Current price | $145.98 | 52-week high | $154.50 |
| Prev. close | $145.68 | 52-week low | $120.71 |
| Day low | $145.29 | Volume | 527,153 |
| Day high | $147.89 | Avg. volume | 659,313 |
| 50-day MA | $140.64 | Dividend yield | 0.77% |
| 200-day MA | $138.91 | Market Cap | 18.28B |
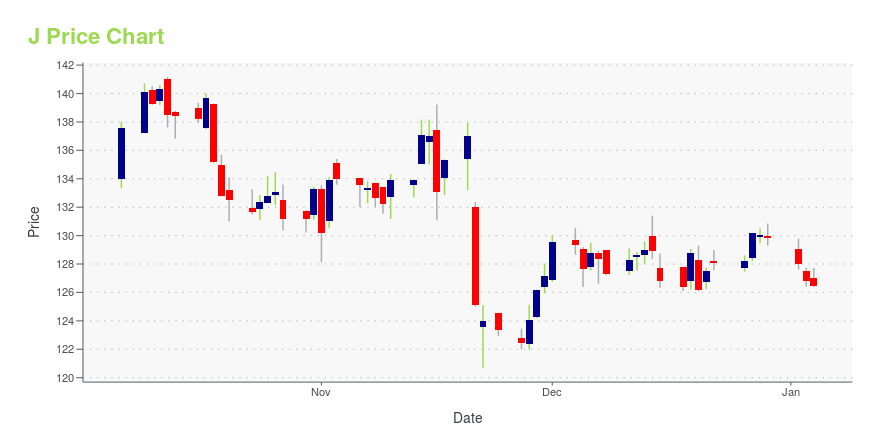
J Stock Price Chart Interactive Chart >
Jacobs Engineering Group Inc. (J) Company Bio
Jacobs Engineering Group Inc. (NYSE: J) is an American international technical professional services firm. The company provides engineering, technical, professional and construction services, as well as scientific and specialty consulting for a broad range of clients globally, including companies, organizations, and government agencies. Jacobs has consistently ranked No. 1 on both Engineering News-Record (ENR)'s 2018, 2019, 2020 & 2021 Top 500 Design Firms and Trenchless Technology’s 2018, 2019, 2020 & 2021 Top 50 Trenchless Engineering Firms. Its worldwide annual revenue reached over $14 billion in the 2021 fiscal year, and earnings rose to over 163 million. (Source:Wikipedia)
Latest J News From Around the Web
Below are the latest news stories about JACOBS SOLUTIONS INC that investors may wish to consider to help them evaluate J as an investment opportunity.
Jacobs Appointed as Sunwater's Engineering and Professional Services PartnerJacobs (NYSE:J), as part of the Prosperity Joint Venture with AECOM, has been appointed as Engineering and Professional Services Partner by Sunwater Limited, a bulk water service provider in Queensland, Australia. The appointment is for an initial five-year period with possible extension for another five years at the end of the term. |
Jacobs to Provide Technical Advisory for M28 Motorway in IrelandJacobs (NYSE:J) has been selected by Cork County Council as technical advisor for the new M28 motorway linking the N40 South Ring Road to the Port of Cork in Ringaskiddy, in County Cork, Ireland. Jacobs' scope includes consultancy services during the design, construction and closeout phases of the project. |
Jacobs Supports Innovative Nuclear Reactor Developer in FranceJacobs (NYSE: J) was selected to support Naarea, a French start-up which is developing a new nuclear power reactor, by assisting with nuclear safety as well as several engineering disciplines including control and instrumentation, mechanical and process. |
Jacobs Reports Fiscal Fourth Quarter and Fiscal Year 2023 EarningsJacobs Solutions Inc. (NYSE: J) today announced its financial results for the fiscal fourth quarter and fiscal year ended September 29, 2023. |
Contractor Jacobs to merge government consulting units with rival AmentumJacobs said in a statement it expects to have up to 63% stake in the combined company, with 51% held by shareholders and 7.5-12% retained by the company. The combined entity, which will include units Critical Mission Solutions (CMS) and Cyber & Intelligence government services, will become a new publicly listed company, Jacobs added. The CMS platform provides cybersecurity, data analytics and software application services and consulting to civilian, defense and intelligence clients in industries including space, national security, nuclear waste and 5G technology. |
J Price Returns
| 1-mo | 5.18% |
| 3-mo | 1.15% |
| 6-mo | 7.06% |
| 1-year | 16.87% |
| 3-year | 12.00% |
| 5-year | 78.67% |
| YTD | 13.15% |
| 2023 | 9.02% |
| 2022 | -13.12% |
| 2021 | 28.60% |
| 2020 | 22.36% |
| 2019 | 54.99% |
J Dividends
| Ex-Dividend Date | Type | Payout Amount | Change | ||||||
|---|---|---|---|---|---|---|---|---|---|
| Loading, please wait... | |||||||||
Loading social stream, please wait...