JBG SMITH Properties Common Shares (JBGS): Price and Financial Metrics
JBGS Price/Volume Stats
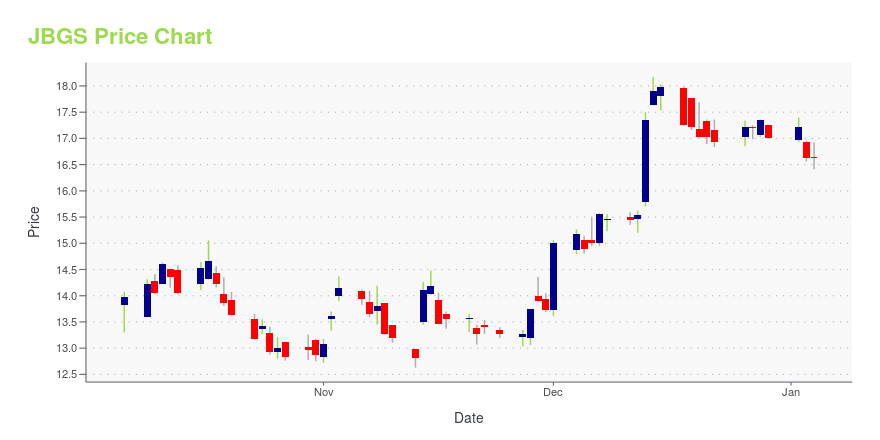
Current price | $13.93 | 52-week high | $21.10 |
Prev. close | $13.91 | 52-week low | $13.37 |
Day low | $13.68 | Volume | 1,423,800 |
Day high | $14.03 | Avg. volume | 1,794,196 |
50-day MA | $15.57 | Dividend yield | 6.47% |
200-day MA | $16.29 | Market Cap | 1.44B |
JBGS Stock Price Chart Interactive Chart >
JBGS POWR Grades
- JBGS scores best on the Growth dimension, with a Growth rank ahead of 86.89% of US stocks.
- The strongest trend for JBGS is in Growth, which has been heading up over the past 179 days.
- JBGS's current lowest rank is in the Sentiment metric (where it is better than 21.41% of US stocks).
JBGS Stock Summary
- The capital turnover (annual revenue relative to shareholder's equity) for JBGS is 0.24 -- better than just 19.41% of US stocks.
- Of note is the ratio of JBG SMITH PROPERTIES's sales and general administrative expense to its total operating expenses; merely 18.96% of US stocks have a lower such ratio.
- The ratio of debt to operating expenses for JBG SMITH PROPERTIES is higher than it is for about 86.57% of US stocks.
- If you're looking for stocks that are quantitatively similar to JBG SMITH PROPERTIES, a group of peers worth examining would be KRP, DO, VAL, EHC, and RLJ.
- Visit JBGS's SEC page to see the company's official filings. To visit the company's web site, go to www.jbgsmith.com.
JBGS Valuation Summary
- In comparison to the median Real Estate stock, JBGS's price/sales ratio is 40.91% lower, now standing at 2.6.
- JBGS's EV/EBIT ratio has moved up 13.4 over the prior 75 months.
Below are key valuation metrics over time for JBGS.
Stock | Date | P/S | P/B | P/E | EV/EBIT |
---|---|---|---|---|---|
JBGS | 2023-09-15 | 2.6 | 0.6 | -57.6 | 56.0 |
JBGS | 2023-09-14 | 2.7 | 0.6 | -58.9 | 56.5 |
JBGS | 2023-09-13 | 2.6 | 0.6 | -57.5 | 56.0 |
JBGS | 2023-09-12 | 2.6 | 0.6 | -58.1 | 56.2 |
JBGS | 2023-09-11 | 2.6 | 0.6 | -58.4 | 56.3 |
JBGS | 2023-09-08 | 2.7 | 0.6 | -59.4 | 56.7 |
JBGS's Quality Factors
The “Quality” component of the POWR Ratings focuses on 31 different factors of a companies fundamentals and operational strength. Here are some key insights as we drill into the specifics of these quality attributes.- JBGS has a Quality Grade of D, ranking ahead of 24.41% of graded US stocks.
- JBGS's asset turnover comes in at 0.104 -- ranking 203rd of 444 Trading stocks.
- BRX, UBA, and APLE are the stocks whose asset turnover ratios are most correlated with JBGS.
The table below shows JBGS's key quality metrics over time.
Period | Asset Turnover | Gross Margin | ROIC |
---|---|---|---|
2021-09-30 | 0.104 | 0.645 | 0.000 |
2021-06-30 | 0.102 | 0.647 | -0.003 |
2021-03-31 | 0.098 | 0.644 | -0.007 |
2020-12-31 | 0.096 | 0.641 | -0.001 |
2020-09-30 | 0.099 | 0.653 | 0.009 |
2020-06-30 | 0.103 | 0.665 | 0.013 |
JBG SMITH Properties Common Shares (JBGS) Company Bio
JBG SMITH Properties operates as a real estate investment trust. The Company owns, operates, and develops mixed use real estate properties. JBG SMITH Properties manages residential, office, retail, and mixed-use properties. The company was formed in 2016, and is based in Chevy Chase Maryland.
Latest JBGS News From Around the Web
Below are the latest news stories about JBG SMITH PROPERTIES that investors may wish to consider to help them evaluate JBGS as an investment opportunity.
Off-site Pentagon parking lots near Amazon's HQ2 could be redeveloped with mixed-useThe plan doesn't say whether the parking areas would be leased or sold, or who would own and operate whatever is built there. |
JBG Smith exec Kristi Smith to lead Downtown Columbia for Howard HughesThe exec played a key role in 4747 Bethesda, HQ2 and the assemblage of new development in National Landing. |
JBG Smith projects a National Landing office retention rate of only 50% through 2024 — Amazon not includedToss in Amazon, which is leaving for Met Park, and the National Landing office retention rate drops to 33%. |
JBG SMITH Announces Second Quarter 2023 ResultsBETHESDA, Md., August 08, 2023--JBG SMITH (NYSE: JBGS), a leading owner and developer of high-quality, mixed-use properties in the Washington, DC market, today filed its Form 10-Q for the quarter ended June 30, 2023 and reported its financial results. |
JBG SMITH Declares a Quarterly Common Dividend of $0.225 Per ShareBETHESDA, Md., August 03, 2023--JBG SMITH (NYSE: JBGS), a leading owner and developer of high-quality, mixed-use properties in the Washington, DC market, today announced that its Board of Trustees has declared a quarterly dividend of $0.225 per common share. The dividend will be paid on August 31, 2023 to common shareholders of record as of August 17, 2023. |
JBGS Price Returns
1-mo | -4.65% |
3-mo | -1.24% |
6-mo | 1.98% |
1-year | -25.35% |
3-year | -39.58% |
5-year | -55.29% |
YTD | -24.35% |
2022 | -31.04% |
2021 | -5.42% |
2020 | -19.22% |
2019 | 17.23% |
2018 | 3.03% |
JBGS Dividends
Ex-Dividend Date | Type | Payout Amount | Change | ||||||
---|---|---|---|---|---|---|---|---|---|
Loading, please wait... |
Continue Researching JBGS
Here are a few links from around the web to help you further your research on JBG SMITH Properties's stock as an investment opportunity:JBG SMITH Properties (JBGS) Stock Price | Nasdaq
JBG SMITH Properties (JBGS) Stock Quote, History and News - Yahoo Finance
JBG SMITH Properties (JBGS) Stock Price and Basic Information | MarketWatch
Loading social stream, please wait...