
J.B. Hunt Transport Services Inc. (JBHT): Price and Financial Metrics
JBHT Price/Volume Stats
| Current price | $171.54 | 52-week high | $219.51 |
| Prev. close | $170.78 | 52-week low | $153.12 |
| Day low | $170.39 | Volume | 711,200 |
| Day high | $174.02 | Avg. volume | 873,966 |
| 50-day MA | $160.97 | Dividend yield | 1.04% |
| 200-day MA | $182.59 | Market Cap | 17.70B |
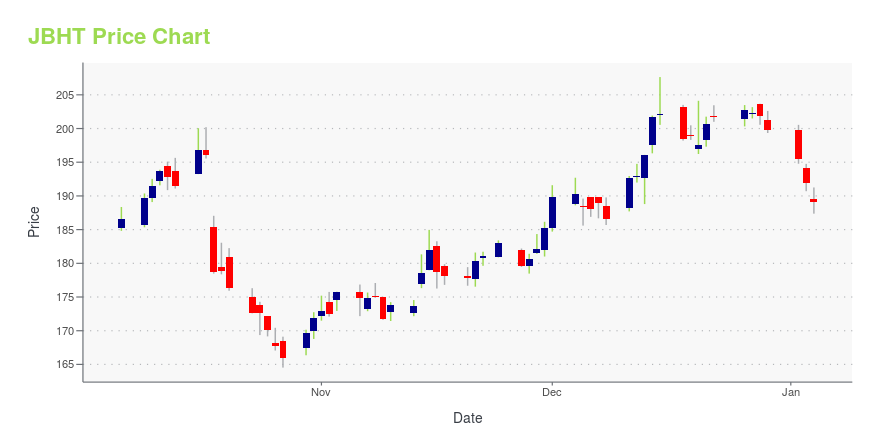
JBHT Stock Price Chart Interactive Chart >
J.B. Hunt Transport Services Inc. (JBHT) Company Bio
J.B. Hunt Transport Services, Inc. is an American transportation and logistics company based in Lowell, Arkansas. It was founded by Johnnie Bryan Hunt and Johnelle Hunt in Arkansas on August 10, 1961. By 1983, J.B. Hunt had grown into the 80th largest trucking firm in the U.S. and earned $623.47 million in revenue. At that time J.B. Hunt was operating 550 tractors, 1,049 trailers, and had roughly 1,050 employees. J.B. Hunt primarily operates large semi-trailer trucks and provides transportation services throughout the continental U.S., Canada and Mexico. The company currently employs over 24,000 and operates more than 12,000 trucks. The company's fleet consists of over 145,000 trailers and containers. (Source:Wikipedia)
Latest JBHT News From Around the Web
Below are the latest news stories about HUNT J B TRANSPORT SERVICES INC that investors may wish to consider to help them evaluate JBHT as an investment opportunity.
J. B. Hunt (JBHT) Weighed Down by Weakness Across SegmentsJ. B. Hunt's (JBHT) is hurt by lower revenues across all business segments, higher net interest expense, and a highly leveraged balance sheet. |
J.B. Hunt Announces Safety and Sustainability Leadership ChangesLOWELL, Ark., December 14, 2023--J.B. Hunt Transport Services Inc. (NASDAQ: JBHT), one of the largest supply chain solutions providers in North America, announced today that Craig Harper will retire from his current duties as chief sustainability officer effective December 31 and Greer Woodruff will assume responsibilities as executive vice president of safety, sustainability and maintenance effective January 1, 2024. |
J.B. Hunt Transport Services (NASDAQ:JBHT) Has More To Do To Multiply In Value Going ForwardTo find a multi-bagger stock, what are the underlying trends we should look for in a business? One common approach is... |
J.B. Hunt Participates in Wreaths Across America for 10th Consecutive YearLOWELL, Ark., December 12, 2023--J.B. Hunt Transport Services Inc. (NASDAQ: JBHT), one of the largest supply chain solutions providers in North America, continued its participation in Wreaths Across America for the tenth consecutive year this week, helping ensure the delivery of more than 355,000 wreaths for the annual event remembering fallen veterans during the holiday season. |
Can J.B. Hunt Finally Get Moving?Shares of the trucking and logistics company have traveled sideways the past 12 months, but just received a fundamental upgrade. Let's look under the hood at the technicals. |
JBHT Price Returns
| 1-mo | 9.17% |
| 3-mo | 6.15% |
| 6-mo | -16.52% |
| 1-year | -13.50% |
| 3-year | 6.44% |
| 5-year | 74.08% |
| YTD | -13.72% |
| 2023 | 15.59% |
| 2022 | -13.92% |
| 2021 | 50.64% |
| 2020 | 18.11% |
| 2019 | 26.77% |
JBHT Dividends
| Ex-Dividend Date | Type | Payout Amount | Change | ||||||
|---|---|---|---|---|---|---|---|---|---|
| Loading, please wait... | |||||||||
Continue Researching JBHT
Want to see what other sources are saying about Hunt J B Transport Services Inc's financials and stock price? Try the links below:Hunt J B Transport Services Inc (JBHT) Stock Price | Nasdaq
Hunt J B Transport Services Inc (JBHT) Stock Quote, History and News - Yahoo Finance
Hunt J B Transport Services Inc (JBHT) Stock Price and Basic Information | MarketWatch
Loading social stream, please wait...