James Hardie Industries PLC ADR (JHX): Price and Financial Metrics
JHX Price/Volume Stats
Current price | $40.46 | 52-week high | $41.98 |
Prev. close | $39.83 | 52-week low | $21.14 |
Day low | $39.85 | Volume | 39,800 |
Day high | $40.63 | Avg. volume | 49,315 |
50-day MA | $38.79 | Dividend yield | N/A |
200-day MA | $31.83 | Market Cap | 17.63B |
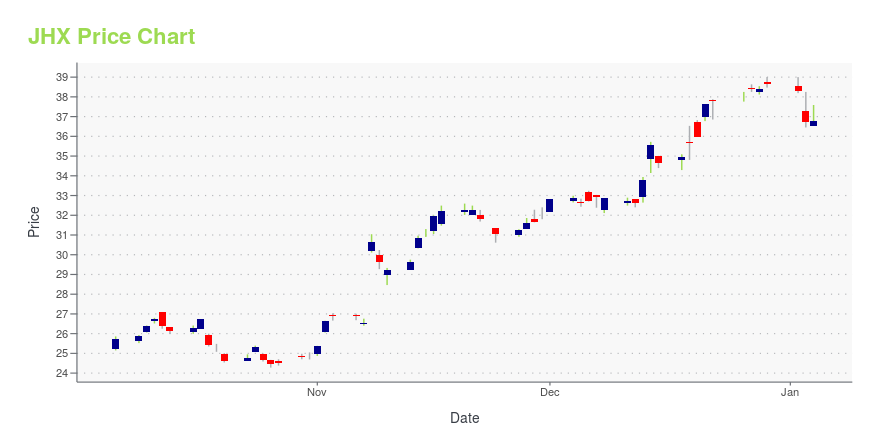
JHX Stock Price Chart Interactive Chart >
JHX POWR Grades
- JHX scores best on the Momentum dimension, with a Momentum rank ahead of 99.42% of US stocks.
- The strongest trend for JHX is in Growth, which has been heading up over the past 26 weeks.
- JHX ranks lowest in Value; there it ranks in the 4th percentile.
JHX Stock Summary
- JHX has a higher market value than 87.34% of US stocks; more precisely, its current market capitalization is $16,083,774,068.
- JHX's one year PEG ratio, measuring expected growth in earnings next year relative to current common stock price is 2,772.08 -- higher than 98.76% of US-listed equities with positive expected earnings growth.
- The price/operating cash flow metric for JAMES HARDIE INDUSTRIES PLC is higher than 76.71% of stocks in our set with a positive cash flow.
- Stocks with similar financial metrics, market capitalization, and price volatility to JAMES HARDIE INDUSTRIES PLC are SNN, CPB, KAI, STRA, and FND.
- Visit JHX's SEC page to see the company's official filings. To visit the company's web site, go to www.ir.jameshardie.com.au.
JHX Valuation Summary
- In comparison to the median Basic Materials stock, JHX's price/earnings ratio is 106.59% higher, now standing at 34.5.
- Over the past 243 months, JHX's price/sales ratio has gone up 1.6.
Below are key valuation metrics over time for JHX.
Stock | Date | P/S | P/B | P/E | EV/EBIT |
---|---|---|---|---|---|
JHX | 2023-12-29 | 4.5 | 9.5 | 34.5 | 23.6 |
JHX | 2023-12-28 | 4.5 | 9.4 | 34.2 | 23.4 |
JHX | 2023-12-27 | 4.5 | 9.4 | 34.2 | 23.5 |
JHX | 2023-12-26 | 4.5 | 9.3 | 33.9 | 23.3 |
JHX | 2023-12-22 | 4.4 | 9.3 | 33.7 | 23.1 |
JHX | 2023-12-21 | 4.4 | 9.2 | 33.5 | 23.0 |
JHX Growth Metrics
- Its 4 year net cashflow from operations growth rate is now at 54.47%.
- Its 5 year revenue growth rate is now at 35.66%.
- Its 4 year cash and equivalents growth rate is now at -3.63%.
The table below shows JHX's growth in key financial areas (numbers in millions of US dollars).
Date | Revenue | Operating Cash Flow | Net Income to Common Stock |
---|---|---|---|
2022-12-31 | 3,827.5 | 636 | 482.8 |
2022-09-30 | 3,866.7 | 664.3 | 518.1 |
2022-06-30 | 3,772.3 | 726.7 | 500.8 |
2022-03-31 | 3,614.7 | 757.2 | 459.1 |
2022-03-31 | 3,614.7 | 757.2 | 459.1 |
2021-12-31 | 3,453.5 | 661.8 | 504.9 |
JHX's Quality Factors
The “Quality” component of the POWR Ratings focuses on 31 different factors of a companies fundamentals and operational strength. Here are some key insights as we drill into the specifics of these quality attributes.- JHX has a Quality Grade of A, ranking ahead of 97.73% of graded US stocks.
- JHX's asset turnover comes in at 0.717 -- ranking 40th of 60 Construction Materials stocks.
- 500 - Internal server error
The table below shows JHX's key quality metrics over time.
Period | Asset Turnover | Gross Margin | ROIC |
---|---|---|---|
2021-03-31 | 0.717 | 0.362 | 0.118 |
2020-03-31 | 0.647 | 0.358 | 0.078 |
2019-03-31 | 0.785 | 0.332 | 0.102 |
2018-03-31 | 0.942 | 0.355 | 0.091 |
2017-03-31 | 0.948 | 0.351 | 0.194 |
2016-03-31 | 0.846 | 0.366 | 0.176 |
James Hardie Industries PLC ADR (JHX) Company Bio
James Hardie Industries plc is a global building materials company and the largest global manufacturer of fibre cement products. Headquartered in Ireland, it is a dual-listed company, being listed on the Australian and New York Stock Exchanges. Its management team currently sits in Chicago, Illinois, United States. James Hardie was plagued by several asbestos-related scandals in the 20th century. (Source:Wikipedia)
Latest JHX News From Around the Web
Below are the latest news stories about JAMES HARDIE INDUSTRIES PLC that investors may wish to consider to help them evaluate JHX as an investment opportunity.
PGT Innovations (PGTI) Gains as It Sells Stake to MasonitePGT Innovations' (PGTI) combination with Masonite is set to provide significant near-term value to its shareholders while enabling them to participate in the long-term upside opportunity of the combined company. |
Are Construction Stocks Lagging James Hardie Industries (JHX) This Year?Here is how James Hardie (JHX) and Lennar (LEN) have performed compared to their sector so far this year. |
Caesarstone (CSTE) to Close Richmond Hill Manufacturing FacilityCaesarstone (CSTE) plans to shut down its Richmond Hill manufacturing facility for $20 million in annual savings. |
Is Now An Opportune Moment To Examine James Hardie Industries plc (ASX:JHX)?Today we're going to take a look at the well-established James Hardie Industries plc ( ASX:JHX ). The company's stock... |
Is James Hardie Industries (JHX) Stock Outpacing Its Construction Peers This Year?Here is how James Hardie (JHX) and Lennar (LEN) have performed compared to their sector so far this year. |
JHX Price Returns
1-mo | 4.14% |
3-mo | 4.63% |
6-mo | 54.19% |
1-year | 85.77% |
3-year | 35.73% |
5-year | 226.00% |
YTD | 4.63% |
2023 | 115.55% |
2022 | -55.54% |
2021 | 38.18% |
2020 | 51.02% |
2019 | 70.78% |
Continue Researching JHX
Want to see what other sources are saying about James Hardie Industries plc's financials and stock price? Try the links below:James Hardie Industries plc (JHX) Stock Price | Nasdaq
James Hardie Industries plc (JHX) Stock Quote, History and News - Yahoo Finance
James Hardie Industries plc (JHX) Stock Price and Basic Information | MarketWatch
Loading social stream, please wait...