Johnson & Johnson (JNJ): Price and Financial Metrics

Johnson & Johnson (JNJ): $156.76

1.42 (-0.90%)

POWR Rating

Component Grades

Momentum

C

Stability

B

Sentiment

Quality

B

JNJ Price/Volume Stats

Current price $156.76 52-week high $175.97
Prev. close $158.18 52-week low $144.95
Day low $156.50 Volume 6,602,200
Day high $158.69 Avg. volume 7,186,756
50-day MA $159.56 Dividend yield 2.99%
200-day MA $159.55 Market Cap 377.76B

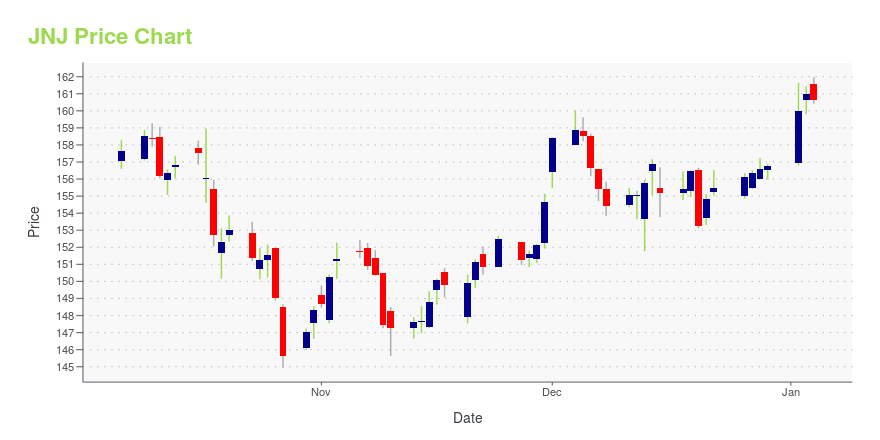
JNJ Stock Price Chart Interactive Chart >

JNJ POWR Grades

  • Quality is the dimension where JNJ ranks best; there it ranks ahead of 92.7% of US stocks.
  • JNJ's strongest trending metric is Growth; it's been moving down over the last 26 weeks.
  • JNJ ranks lowest in Momentum; there it ranks in the 6th percentile.

JNJ Stock Summary

  • JOHNSON & JOHNSON's market capitalization of $387,499,639,461 is ahead of 99.58% of US-listed equities.
  • JNJ's went public 38.03 years ago, making it older than 92.92% of listed US stocks we're tracking.
  • The volatility of JOHNSON & JOHNSON's share price is greater than that of merely 2.23% US stocks with at least 200 days of trading history.
  • Stocks with similar financial metrics, market capitalization, and price volatility to JOHNSON & JOHNSON are ABBV, ADBE, XOM, MA, and V.
  • Visit JNJ's SEC page to see the company's official filings. To visit the company's web site, go to www.jnj.com.

JNJ Valuation Summary

  • JNJ's EV/EBIT ratio is 10.2; this is 30.14% lower than that of the median Healthcare stock.
  • Over the past 243 months, JNJ's price/sales ratio has gone up 0.2.

Below are key valuation metrics over time for JNJ.

Stock Date P/S P/B P/E EV/EBIT
JNJ 2023-12-29 4.0 5.3 10.9 10.2
JNJ 2023-12-28 4.0 5.3 10.9 10.2
JNJ 2023-12-27 3.9 5.3 10.9 10.1
JNJ 2023-12-26 3.9 5.3 10.9 10.1
JNJ 2023-12-22 3.9 5.3 10.8 10.1
JNJ 2023-12-21 3.9 5.2 10.8 10.1

JNJ Growth Metrics

    The 2 year net income to common stockholders growth rate now stands at 15.52%.
  • Its year over year net income to common stockholders growth rate is now at 31.19%.
  • Its 2 year cash and equivalents growth rate is now at -32.63%.
Over the past 70 months, JNJ's revenue has gone up $22,769,000,000.

The table below shows JNJ's growth in key financial areas (numbers in millions of US dollars).

Date Revenue Operating Cash Flow Net Income to Common Stock
2022-12-31 94,943 21,194 17,941
2022-09-30 96,041 21,576 19,157
2022-06-30 95,588 23,582 18,366
2022-03-31 94,880 23,315 19,830
2021-12-31 93,775 23,410 20,878
2021-09-30 91,446 26,021 17,880

JNJ's Quality Factors

The “Quality” component of the POWR Ratings focuses on 31 different factors of a companies fundamentals and operational strength. Here are some key insights as we drill into the specifics of these quality attributes.
  • JNJ has a Quality Grade of B, ranking ahead of 92.45% of graded US stocks.
  • JNJ's asset turnover comes in at 0.52 -- ranking 78th of 682 Pharmaceutical Products stocks.
  • CBIO, CLSD, and ABBV are the stocks whose asset turnover ratios are most correlated with JNJ.

The table below shows JNJ's key quality metrics over time.

Period Asset Turnover Gross Margin ROIC
2021-10-03 0.520 0.675 0.295
2021-07-04 0.514 0.670 0.302
2021-04-04 0.498 0.662 0.273
2021-01-03 0.501 0.656 0.272
2020-09-27 0.504 0.657 0.332
2020-06-28 0.514 0.657 0.307

JNJ Price Target

For more insight on analysts targets of JNJ, see our JNJ price target page. And for a list of of all stocks sorted by upside potential based on analyst target price, see our Top Price Target page.

Average Price Target $187.95 Average Broker Recommendation 1.53 (Moderate Buy)

Johnson & Johnson (JNJ) Company Bio


Founded in 1886, Johnson & Johnson is a holding company, which is engaged in the research and development, manufacture, and sale of products in the healthcare field within its Consumer, Pharmaceutical and Medical Devices segments. The Consumer segment consists of skin and self-care product brand names such as Aveeno, Neutrogena, Rogaine, Tylenol, Motrin, Listerine, and Band-Aid. Johnson’s Pharmaceutical segment contains biopharma products that address immune, cardiovascular, metabolic, and infectious disease medical conditions. The Medical Device segment develops products centered around orthopedic, surgical, intervention, and vision solutions. The company has over 130,000 employees worldwide and is headquartered in New Brunswick, New Jersey. The company’s current Chief Executive Officer is Alex Gorsky.


JNJ Latest News Stream


Event/Time News Detail
Loading, please wait...

JNJ Latest Social Stream


Loading social stream, please wait...

View Full JNJ Social Stream

Latest JNJ News From Around the Web

Below are the latest news stories about JOHNSON & JOHNSON that investors may wish to consider to help them evaluate JNJ as an investment opportunity.

2024’s Blue-Chip Winners: Top 3 Stocks for Rock-Solid Returns

Some blue-chip stocks are poised to outperform others this year, so consider adding these to your portfolio.

Matthew Farley on InvestorPlace | January 1, 2024

Legacy Investments: 7 Stocks to Make Your Grandkids Millionaires

If you believe in long-term investing like me, you will look for stocks that have a strong performance history and an ability to thrive in uncertain situations.

Vandita Jadeja on InvestorPlace | December 31, 2023

Disaster-Proof Dividends: 3 Stocks with Resilient Payouts in Tough Times

Enjoy steady passive income and capital growth in your portfolio through these three dividend stocks with steady payouts.

Vandita Jadeja on InvestorPlace | December 29, 2023

Safe Havens: 3 Fixed-Income Securities for a Balanced Portfolio in 2024

If you are looking for safe havens to turn to in 2024 then you should consider adding these investments to your portfolio.

Matthew Farley on InvestorPlace | December 28, 2023

11 Set-It-and-Forget-It Stocks to Buy According to Financial Media

In this article, we discuss the 11 set-it-and-forget-it stocks to buy according to financial media. To skip the overview of set-it-and-forget-it stocks and portfolios, go directly to the 5 Set-It-and-Forget-It Stocks to Buy According to Financial Media. Some stocks are meant to be kept forever according to financial media and investors. The set-it-and-forget-it stock portfolio […]

Yahoo | December 28, 2023

Read More 'JNJ' Stories Here

JNJ Price Returns

1-mo 0.13%
3-mo 0.95%
6-mo -2.27%
1-year 6.04%
3-year 6.33%
5-year 30.85%
YTD 0.77%
2023 -8.58%
2022 5.97%
2021 11.44%
2020 10.82%
2019 16.22%

JNJ Dividends

Ex-Dividend Date Type Payout Amount Change
Loading, please wait...
View Full JNJ Dividend History

Continue Researching JNJ

Want to see what other sources are saying about Johnson & Johnson's financials and stock price? Try the links below:

Johnson & Johnson (JNJ) Stock Price | Nasdaq
Johnson & Johnson (JNJ) Stock Quote, History and News - Yahoo Finance
Johnson & Johnson (JNJ) Stock Price and Basic Information | MarketWatch

Get Free Updates

Join thousands of investors who get the latest news, insights and top rated picks from StockNews.com!