John Wiley & Sons, Inc. (JW.A): Price and Financial Metrics
GET POWR RATINGS... FREE!
JW.A POWR Grades
- Quality is the dimension where JW.A ranks best; there it ranks ahead of 89.46% of US stocks.
- The strongest trend for JW.A is in Momentum, which has been heading down over the past 179 days.
- JW.A's current lowest rank is in the Growth metric (where it is better than 42.16% of US stocks).
JW.A Stock Summary
- JW.A's went public 32.03 years ago, making it older than 84.38% of listed US stocks we're tracking.
- Over the past twelve months, JW.A has reported earnings growth of -1,094.72%, putting it ahead of merely 1.96% of US stocks in our set.
- The volatility of John Wiley & Sons Inc's share price is greater than that of only 11.24% US stocks with at least 200 days of trading history.
- Stocks that are quantitatively similar to JW.A, based on their financial statements, market capitalization, and price volatility, are FSTR, PLUS, CATC, VPG, and OCC.
- JW.A's SEC filings can be seen here. And to visit John Wiley & Sons Inc's official web site, go to www.wiley.com.
JW.A Valuation Summary
- In comparison to the median Consumer Cyclical stock, JW.A's EV/EBIT ratio is 28.74% higher, now standing at 21.5.
- Over the past 243 months, JW.A's price/sales ratio has gone down 0.3.
Below are key valuation metrics over time for JW.A.
Stock | Date | P/S | P/B | P/E | EV/EBIT |
---|---|---|---|---|---|
JW.A | 2021-08-27 | 1.7 | 3.0 | 22.1 | 21.5 |
JW.A | 2021-08-26 | 1.6 | 2.9 | 21.4 | 21.0 |
JW.A | 2021-08-25 | 1.7 | 3.0 | 22.0 | 21.4 |
JW.A | 2021-08-24 | 1.7 | 3.0 | 21.9 | 21.4 |
JW.A | 2021-08-23 | 1.7 | 3.0 | 21.8 | 21.3 |
JW.A | 2021-08-20 | 1.6 | 2.9 | 21.5 | 21.1 |
JW.A Growth Metrics
- Its 4 year net cashflow from operations growth rate is now at -17.58%.
- Its 4 year net income to common stockholders growth rate is now at -150.96%.
- The 3 year cash and equivalents growth rate now stands at -74.47%.

The table below shows JW.A's growth in key financial areas (numbers in millions of US dollars).
Date | Revenue | Operating Cash Flow | Net Income to Common Stock |
---|---|---|---|
2021-12-31 | 2,073.527 | 363.581 | 146.492 |
2021-09-30 | 2,040.555 | 360.923 | 133.287 |
2021-06-30 | 1,998.563 | 395.932 | 145.752 |
2021-03-31 | 1,941.501 | 359.923 | 148.256 |
2020-12-31 | 1,879.866 | 354.374 | -51.117 |
2020-09-30 | 1,864.085 | 311.334 | -37.835 |
JW.A's Quality Factors
The “Quality” component of the POWR Ratings focuses on 31 different factors of a companies fundamentals and operational strength. Here are some key insights as we drill into the specifics of these quality attributes.- JW.A has a Quality Grade of B, ranking ahead of 81.53% of graded US stocks.
- JW.A's asset turnover comes in at 0.603 -- ranking 9th of 14 Printing and Publishing stocks.
- DJCO, TRI, and HMHC are the stocks whose asset turnover ratios are most correlated with JW.A.
The table below shows JW.A's key quality metrics over time.
Period | Asset Turnover | Gross Margin | ROIC |
---|---|---|---|
2021-07-31 | 0.603 | 0.677 | 0.165 |
2021-04-30 | 0.599 | 0.678 | 0.155 |
2021-01-31 | 0.593 | 0.677 | -0.018 |
2020-10-31 | 0.593 | 0.676 | -0.003 |
2020-07-31 | 0.582 | 0.678 | -0.011 |
2020-04-30 | 0.577 | 0.677 | -0.032 |
JW.A Price Target
For more insight on analysts targets of JW.A, see our JW.A price target page. And for a list of of all stocks sorted by upside potential based on analyst target price, see our Top Price Target page.
Average Price Target | $66.00 | Average Broker Recommendation | 1.75 (Moderate Buy) |
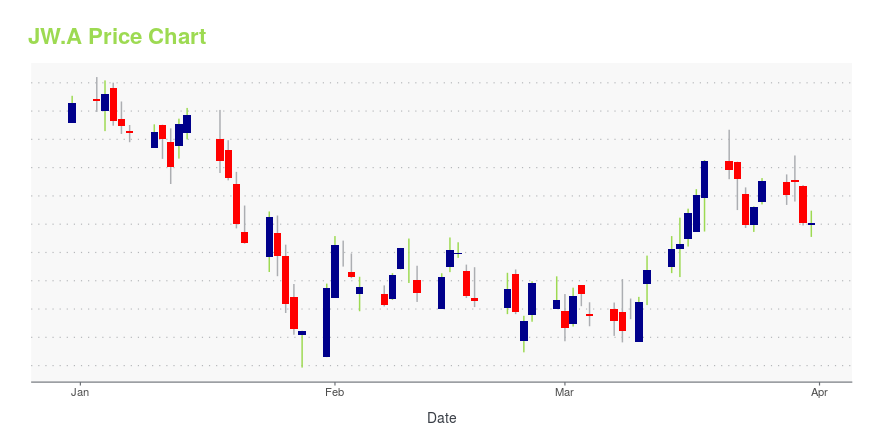
JW.A Stock Price Chart Interactive Chart >
JW.A Price/Volume Stats
Current price | $53.03 | 52-week high | $66.04 |
Prev. close | $53.05 | 52-week low | $47.93 |
Day low | $52.55 | Volume | 271,200 |
Day high | $53.48 | Avg. volume | 196,298 |
50-day MA | $51.63 | Dividend yield | 2.6% |
200-day MA | $54.81 | Market Cap | 2.95B |
John Wiley & Sons, Inc. (JW.A) Company Bio
John Wiley & Sons, Inc. provides knowledge and knowledge-enabled services in the areas of research, professional practice and education. The Company operates through three segments: Research, Professional Development and Education. The company was founded in 1807 and is based in Hoboken, New Jersey.
Latest JW.A News From Around the Web
Below are the latest news stories about John Wiley & Sons Inc that investors may wish to consider to help them evaluate JW.A as an investment opportunity.
John Wiley Stock? No. Short Puts? AbsolutelyNo summary available. |
John Wiley & Sons, Inc. 2021 Q2 - Results - Earnings Call PresentationNo summary available. |
John Wiley & Sons reports Q2 resultsNo summary available. |
Here''s what Wall Street expects from John Wiley Sons A''s earningsJohn Wiley Sons A will report earnings from the most recent quarter on December 7. Analysts predict John Wiley Sons A will release earnings per share of $1.15. Follow John Wiley Sons A stock price in real-time here. |
John Wiley Sons B is about to announce its earnings here''s what to expectJohn Wiley Sons B will release figures for Q2 on December 7. Wall Street predict expect John Wiley Sons B will report earnings per share of $1.15 Follow John Wiley Sons B stock price in real-time on Markets Insider here. |
JW.A Price Returns
1-mo | N/A |
3-mo | 4.83% |
6-mo | 2.70% |
1-year | -14.21% |
3-year | 37.05% |
5-year | 20.32% |
YTD | -6.80% |
2021 | 28.57% |
2020 | -2.43% |
2019 | 6.41% |
2018 | -26.39% |
2017 | 23.42% |
JW.A Dividends
Ex-Dividend Date | Type | Payout Amount | Change | ||||||
---|---|---|---|---|---|---|---|---|---|
Loading, please wait... |
Continue Researching JW.A
Want to do more research on John Wiley & Sons Inc's stock and its price? Try the links below:John Wiley & Sons Inc (JW.A) Stock Price | Nasdaq
John Wiley & Sons Inc (JW.A) Stock Quote, History and News - Yahoo Finance
John Wiley & Sons Inc (JW.A) Stock Price and Basic Information | MarketWatch
Loading social stream, please wait...