Kaman Corporation (KAMN): Price and Financial Metrics
GET POWR RATINGS... FREE!
KAMN POWR Grades
- Value is the dimension where KAMN ranks best; there it ranks ahead of 63.08% of US stocks.
- KAMN's strongest trending metric is Quality; it's been moving down over the last 177 days.
- KAMN ranks lowest in Sentiment; there it ranks in the 11th percentile.
KAMN Stock Summary
- The price/operating cash flow metric for KAMAN CORP is higher than 99.26% of stocks in our set with a positive cash flow.
- With a year-over-year growth in debt of 208.73%, KAMAN CORP's debt growth rate surpasses 93.14% of about US stocks.
- Shareholder yield, a measure of how much is returned to shareholders via dividends and share repurchases, for KAMN comes in at -57.84% -- higher than that of merely 9.22% of stocks in our set.
- Stocks with similar financial metrics, market capitalization, and price volatility to KAMAN CORP are CMCO, LXFR, GAMB, HAE, and MTRN.
- Visit KAMN's SEC page to see the company's official filings. To visit the company's web site, go to www.kaman.com.
KAMN Valuation Summary
- In comparison to the median Industrials stock, KAMN's price/earnings ratio is 77.89% higher, now standing at 36.2.
- KAMN's EV/EBIT ratio has moved up 38 over the prior 243 months.
Below are key valuation metrics over time for KAMN.
Stock | Date | P/S | P/B | P/E | EV/EBIT |
---|---|---|---|---|---|
KAMN | 2023-01-24 | 1.0 | 0.8 | 36.2 | 31.9 |
KAMN | 2023-01-23 | 1.0 | 0.8 | 36.3 | 31.9 |
KAMN | 2023-01-20 | 1.0 | 0.8 | 35.8 | 31.7 |
KAMN | 2023-01-19 | 0.9 | 0.8 | 35.3 | 31.5 |
KAMN | 2023-01-18 | 0.9 | 0.8 | 35.1 | 31.4 |
KAMN | 2023-01-17 | 1.0 | 0.8 | 35.9 | 31.8 |
KAMN Growth Metrics
- The 2 year revenue growth rate now stands at -13.34%.
- Its 4 year cash and equivalents growth rate is now at 1096.96%.
- Its 2 year net cashflow from operations growth rate is now at 158.33%.

The table below shows KAMN's growth in key financial areas (numbers in millions of US dollars).
Date | Revenue | Operating Cash Flow | Net Income to Common Stock |
---|---|---|---|
2022-09-30 | 665.965 | 0.875 | 17.886 |
2022-06-30 | 673.797 | 36.467 | 31.928 |
2022-03-31 | 695.425 | 50.096 | 39.72 |
2021-12-31 | 708.993 | 48.698 | 43.676 |
2021-09-30 | 719.134 | 82.971 | 3.087 |
2021-06-30 | 753.257 | 81.146 | -50.087 |
KAMN's Quality Factors
The “Quality” component of the POWR Ratings focuses on 31 different factors of a companies fundamentals and operational strength. Here are some key insights as we drill into the specifics of these quality attributes.- KAMN has a Quality Grade of C, ranking ahead of 54.88% of graded US stocks.
- KAMN's asset turnover comes in at 0.576 -- ranking 94th of 105 Wholesale stocks.
- NHTC, ASH, and DPZ are the stocks whose asset turnover ratios are most correlated with KAMN.
The table below shows KAMN's key quality metrics over time.
Period | Asset Turnover | Gross Margin | ROIC |
---|---|---|---|
2021-10-01 | 0.576 | 0.323 | 0.030 |
2021-07-02 | 0.581 | 0.313 | -0.039 |
2021-04-02 | 0.542 | 0.308 | -0.055 |
2020-12-31 | 0.536 | 0.313 | -0.061 |
2020-10-02 | 0.561 | 0.315 | -0.002 |
2020-07-03 | 0.538 | 0.320 | 0.210 |
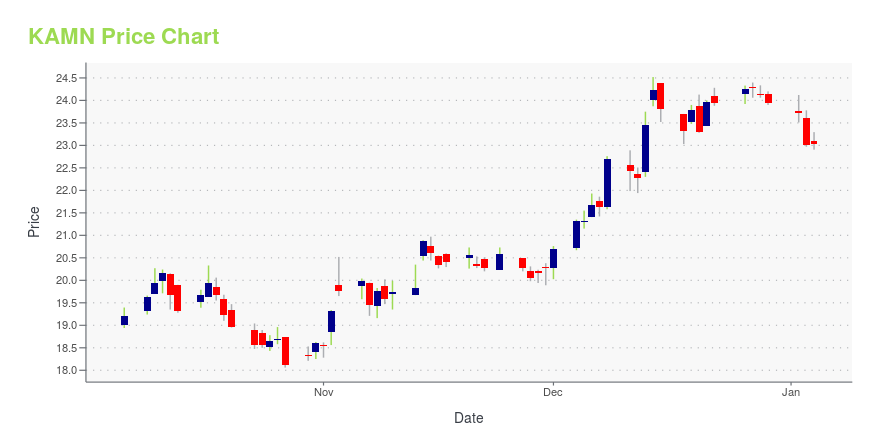
KAMN Stock Price Chart Interactive Chart >
KAMN Price/Volume Stats
Current price | $23.89 | 52-week high | $46.50 |
Prev. close | $23.77 | 52-week low | $18.88 |
Day low | $23.45 | Volume | 95,700 |
Day high | $24.00 | Avg. volume | 131,135 |
50-day MA | $21.42 | Dividend yield | 3.35% |
200-day MA | $29.79 | Market Cap | 669.37M |
Kaman Corporation (KAMN) Company Bio
Kaman Corporation produces and/or markets widely used proprietary aircraft bearings and components; complex metallic and composite aerostructures for commercial, military and general aviation fixed and rotary wing aircraft; aerostructure engineering design analysis and FAA certification services; safe and arm solutions for missile and bomb systems for the U.S. and allied militaries; K-MAX® medium to heavy lift helicopters; and support for the company's SH-2G Super Seasprite maritime helicopters and K-MAX® aircraft. The company was founded in 1945 and is based in Bloomfield, Connecticut.
Latest KAMN News From Around the Web
Below are the latest news stories about KAMAN CORP that investors may wish to consider to help them evaluate KAMN as an investment opportunity.
Kaman Announces Next Transformational Steps to Optimize Cost Structure and Focus on Highest Growth OpportunitiesBLOOMFIELD, Conn., January 18, 2023--Kaman Corporation (NYSE: KAMN) (the "Company") today announced the next phase in its portfolio reshaping efforts to optimize its cost structure, focus resources on the most compelling growth opportunities, improve financial performance and position Kaman to deliver sustainable shareholder value. |
Are Investors Inclined To Sell Their Kaman Corporation (NYSE: KAMN) Holdings?Kaman Corporation (NYSE:KAMN) traded at $22.30 at close of the session on Friday, 12/30/22, made an upward move of 1.92% on its previous day’s price. Looking at the stock we see that its previous close was $21.88 and the beta (5Y monthly) reads 1.14 with the day’s price range being $21.66 – $22.38. The company … Are Investors Inclined To Sell Their Kaman Corporation (NYSE: KAMN) Holdings? Read More » |
Kaman Announces Next Phase of TransformationBLOOMFIELD, Conn., December 08, 2022--(NYSE:KAMN) Kaman Corporation (the "Company") today announced actions to continue reshaping the Company’s portfolio, enhance operational efficiency, improve financial performance and position Kaman for long-term growth and sustainable value creation. |
Kaman: Recent Acquisition Might Hurt Performance (NYSE:KAMN)Kaman might face trouble maintaining its margins due to the high expenses to develop the acquired business. Click here to read my analysis of KAMN stock |
15 Most Volatile Stocks to Buy NowIn this article, we discuss the 15 most volatile stocks to buy now. If you want to read about some more volatile stocks, go directly to 5 Most Volatile Stocks to Buy Now. Even though the United States stock market is inextricably linked to the US economy, there are increased fears that the factors contributing […] |
KAMN Price Returns
1-mo | 11.95% |
3-mo | -30.20% |
6-mo | -21.10% |
1-year | -38.66% |
3-year | -60.12% |
5-year | -58.18% |
YTD | 7.13% |
2022 | -46.89% |
2021 | -23.10% |
2020 | -11.76% |
2019 | 19.06% |
2018 | -3.46% |
KAMN Dividends
Ex-Dividend Date | Type | Payout Amount | Change | ||||||
---|---|---|---|---|---|---|---|---|---|
Loading, please wait... |
Continue Researching KAMN
Want to do more research on KAMAN Corp's stock and its price? Try the links below:KAMAN Corp (KAMN) Stock Price | Nasdaq
KAMAN Corp (KAMN) Stock Quote, History and News - Yahoo Finance
KAMAN Corp (KAMN) Stock Price and Basic Information | MarketWatch
Loading social stream, please wait...