
KB Home (KBH): Price and Financial Metrics
KBH Price/Volume Stats
| Current price | $83.76 | 52-week high | $84.90 |
| Prev. close | $81.46 | 52-week low | $42.11 |
| Day low | $82.99 | Volume | 1,910,800 |
| Day high | $84.90 | Avg. volume | 1,282,753 |
| 50-day MA | $71.86 | Dividend yield | 1.22% |
| 200-day MA | $62.87 | Market Cap | 6.30B |
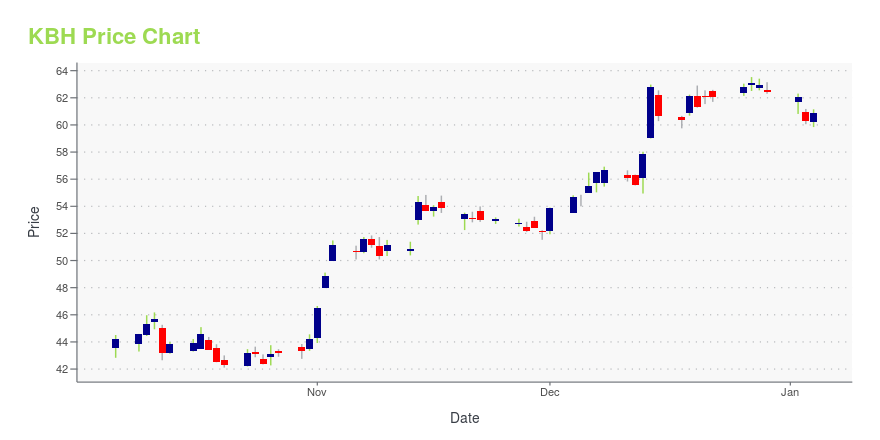
KBH Stock Price Chart Interactive Chart >
KB Home (KBH) Company Bio
KB Home constructs and sells various homes, including attached and detached single-family residential homes, townhomes, and condominiums primarily for first-time, move-up, and active adult homebuyers under the name KB Home. The company was founded in 1957 and is based in Los Angeles, California.
Latest KBH News From Around the Web
Below are the latest news stories about KB HOME that investors may wish to consider to help them evaluate KBH as an investment opportunity.
KB Home (KBH) Rises Higher Than Market: Key FactsKB Home (KBH) reachead $63.07 at the closing of the latest trading day, reflecting a +0.46% change compared to its last close. |
Dream Finders (DFH) Gains 317% YTD: Will it Continue in 2024?Dream Finders (DFH) is poised to benefit from the lack of existing home supply and the Fed's decision to stabilize interest rates. |
Is KB Home's (NYSE:KBH) Recent Stock Performance Tethered To Its Strong Fundamentals?Most readers would already be aware that KB Home's (NYSE:KBH) stock increased significantly by 37% over the past three... |
KB Home to Release 2023 Fourth Quarter and Full Year Earnings on January 10, 2024LOS ANGELES, December 21, 2023--KB Home (NYSE: KBH) today announced that it will release earnings for its fourth quarter and fiscal year ended November 30, 2023 after the market closes on Wednesday, January 10, 2024. A live webcast of the Company’s earnings conference call will be held the same day at 2:00 p.m. Pacific Time, 5:00 p.m. Eastern Time. |
KB Home Announces the Grand Opening of Its Newest Community in Popular Land O’ Lakes, FloridaTAMPA, Fla., December 21, 2023--KB Home (NYSE: KBH) today announced the grand opening of Riverstone, its latest new-home community in Land O’ Lakes. These new homes are designed for the way people live today, with popular interior features like modern kitchens overlooking large great rooms, expansive bedroom suites with walk-in closets, and lofts. The community’s one- and two-story floor plans feature up to six bedrooms and three baths. Riverstone also has no CDD fees and is zoned for the highly |
KBH Price Returns
| 1-mo | 21.71% |
| 3-mo | 28.14% |
| 6-mo | 41.76% |
| 1-year | 60.19% |
| 3-year | 112.56% |
| 5-year | 236.20% |
| YTD | 35.04% |
| 2023 | 99.04% |
| 2022 | -27.48% |
| 2021 | 35.29% |
| 2020 | -0.86% |
| 2019 | 82.74% |
KBH Dividends
| Ex-Dividend Date | Type | Payout Amount | Change | ||||||
|---|---|---|---|---|---|---|---|---|---|
| Loading, please wait... | |||||||||
Continue Researching KBH
Want to see what other sources are saying about Kb Home's financials and stock price? Try the links below:Kb Home (KBH) Stock Price | Nasdaq
Kb Home (KBH) Stock Quote, History and News - Yahoo Finance
Kb Home (KBH) Stock Price and Basic Information | MarketWatch
Loading social stream, please wait...