Kulicke and Soffa Industries, Inc. (KLIC): Price and Financial Metrics
GET POWR RATINGS... FREE!
KLIC POWR Grades
- Value is the dimension where KLIC ranks best; there it ranks ahead of 94.49% of US stocks.
- The strongest trend for KLIC is in Value, which has been heading down over the past 177 days.
- KLIC's current lowest rank is in the Growth metric (where it is better than 1.41% of US stocks).
KLIC Stock Summary
- KULICKE & SOFFA INDUSTRIES INC's stock had its IPO on March 26, 1990, making it an older stock than 85.87% of US equities in our set.
- With a price/earnings ratio of 6.94, KULICKE & SOFFA INDUSTRIES INC P/E ratio is greater than that of about only 17.23% of stocks in our set with positive earnings.
- KULICKE & SOFFA INDUSTRIES INC's shareholder yield -- a measure of how much capital is returned to stockholders via dividends and buybacks -- is 10.67%, greater than the shareholder yield of 85.46% of stocks in our set.
- Stocks that are quantitatively similar to KLIC, based on their financial statements, market capitalization, and price volatility, are SRDX, FKWL, ONTX, ICPT, and GANX.
- KLIC's SEC filings can be seen here. And to visit KULICKE & SOFFA INDUSTRIES INC's official web site, go to www.kns.com.
KLIC Valuation Summary
- KLIC's price/sales ratio is 2; this is 23.08% lower than that of the median Technology stock.
- KLIC's EV/EBIT ratio has moved up 7.3 over the prior 243 months.
Below are key valuation metrics over time for KLIC.
Stock | Date | P/S | P/B | P/E | EV/EBIT |
---|---|---|---|---|---|
KLIC | 2023-01-25 | 2.0 | 2.5 | 6.9 | 5.2 |
KLIC | 2023-01-24 | 1.9 | 2.5 | 6.8 | 5.1 |
KLIC | 2023-01-23 | 2.0 | 2.5 | 6.9 | 5.2 |
KLIC | 2023-01-20 | 1.9 | 2.4 | 6.5 | 4.9 |
KLIC | 2023-01-19 | 1.9 | 2.3 | 6.5 | 4.8 |
KLIC | 2023-01-18 | 1.9 | 2.4 | 6.5 | 4.8 |
KLIC Growth Metrics
- Its 2 year net cashflow from operations growth rate is now at 1665.24%.
- Its 2 year price growth rate is now at 108.64%.
- Its year over year net income to common stockholders growth rate is now at 239.03%.

The table below shows KLIC's growth in key financial areas (numbers in millions of US dollars).
Date | Revenue | Operating Cash Flow | Net Income to Common Stock |
---|---|---|---|
2022-09-30 | 1,503.62 | 390.188 | 433.545 |
2022-06-30 | 1,702.633 | 397.001 | 502.352 |
2022-03-31 | 1,754.814 | 383.321 | 497.084 |
2021-12-31 | 1,710.695 | 337.271 | 452.403 |
2021-09-30 | 1,517.664 | 300.032 | 367.161 |
2021-06-30 | 1,210.026 | 208.387 | 249.233 |
KLIC's Quality Factors
The “Quality” component of the POWR Ratings focuses on 31 different factors of a companies fundamentals and operational strength. Here are some key insights as we drill into the specifics of these quality attributes.- KLIC has a Quality Grade of B, ranking ahead of 85.65% of graded US stocks.
- KLIC's asset turnover comes in at 0.994 -- ranking 45th of 208 Electronic Equipment stocks.
- CIEN, MPWR, and CLRO are the stocks whose asset turnover ratios are most correlated with KLIC.
The table below shows KLIC's key quality metrics over time.
Period | Asset Turnover | Gross Margin | ROIC |
---|---|---|---|
2021-07-03 | 0.994 | 0.458 | 0.447 |
2021-04-03 | 0.834 | 0.457 | 0.289 |
2021-01-02 | 0.680 | 0.467 | 0.180 |
2020-10-03 | 0.571 | 0.478 | 0.126 |
2020-06-27 | 0.534 | 0.469 | 0.108 |
2020-03-28 | 0.503 | 0.470 | 0.094 |
KLIC Price Target
For more insight on analysts targets of KLIC, see our KLIC price target page. And for a list of of all stocks sorted by upside potential based on analyst target price, see our Top Price Target page.
Average Price Target | $79.80 | Average Broker Recommendation | 1.6 (Moderate Buy) |
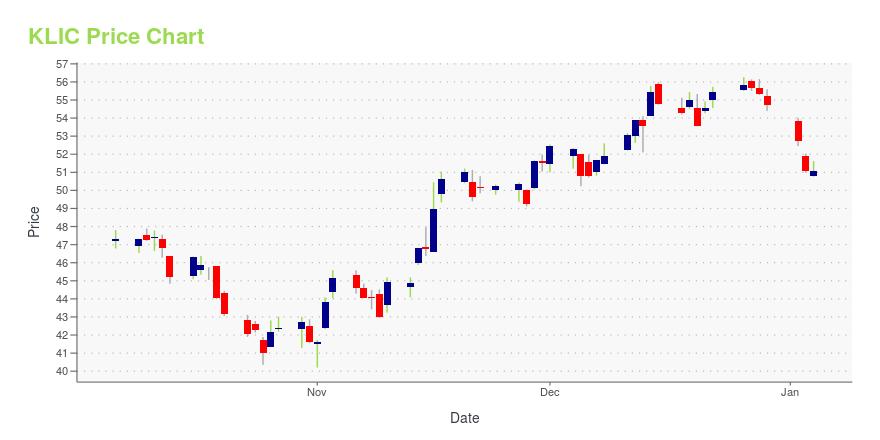
KLIC Stock Price Chart Interactive Chart >
KLIC Price/Volume Stats
Current price | $50.54 | 52-week high | $62.16 |
Prev. close | $51.66 | 52-week low | $35.95 |
Day low | $50.27 | Volume | 347,700 |
Day high | $51.36 | Avg. volume | 484,179 |
50-day MA | $47.60 | Dividend yield | 1.47% |
200-day MA | $45.93 | Market Cap | 2.88B |
Kulicke and Soffa Industries, Inc. (KLIC) Company Bio
Kulicke & Soffa designs, manufactures, and sells capital equipment and expendable tools to assemble semiconductor devices, including integrated circuits, discrete devices, light-emitting diodes, and power modules. It operates in two segments, Equipment and Expendable Tools. The company was founded in 1951 and is based in Singapore.
Latest KLIC News From Around the Web
Below are the latest news stories about KULICKE & SOFFA INDUSTRIES INC that investors may wish to consider to help them evaluate KLIC as an investment opportunity.
7 Tech Stocks Every Smart Investor Should Own in 2023While innovators suffered significantly last year, the subsequent discounts makes tech stocks to own in 2023 quite attractive. |
7 Little-Known Stocks That Will Make You Rich in 10 YearsAlthough going off the path least traveled presents risks, adventure seekers may like these little-known stocks that will make you rich in 10 years. |
2 Cheap Tech Stocks to Buy Right NowLast year's interest rate increases are reminding everyone about the merits of value investing, but that doesn't mean you should ignore tech stocks. While "tech" gets a bad rap due to many high-profile yet unprofitable companies -- mostly in the software or EV spaces -- many hardware companies are very cheap on a multiple of current earnings. Here are two dividend-paying hardware companies powering each of those big trends, and their stocks can be had at bargain-basement valuations today. |
Kulicke & Soffa Schedules First Quarter 2023 Conference Call for 8AM EST, February 2nd, 2023Kulicke and Soffa Industries, Inc. (NASDAQ: KLIC) ("Kulicke & Soffa", "K&S" or the "Company"), a global leader in the design and manufacture of semiconductor, LED and electronic assembly equipment, today announced a conference call is scheduled to discuss the Company's first fiscal quarter 2023 financial results, and its business outlook, on Thursday, February 2, 2023, at 8:00am EST. |
The Top 7 Emerging Market Stocks to Consider for DiversificationAlthough the U.S. offers arguably the safest place for your money, emerging market stocks delivers tempting upside potential. |
KLIC Price Returns
1-mo | 14.19% |
3-mo | 24.49% |
6-mo | 2.51% |
1-year | -6.18% |
3-year | 104.55% |
5-year | 135.00% |
YTD | 14.19% |
2022 | -25.78% |
2021 | 92.36% |
2020 | 19.43% |
2019 | 36.94% |
2018 | -15.32% |
KLIC Dividends
Ex-Dividend Date | Type | Payout Amount | Change | ||||||
---|---|---|---|---|---|---|---|---|---|
Loading, please wait... |
Continue Researching KLIC
Want to do more research on Kulicke & Soffa Industries Inc's stock and its price? Try the links below:Kulicke & Soffa Industries Inc (KLIC) Stock Price | Nasdaq
Kulicke & Soffa Industries Inc (KLIC) Stock Quote, History and News - Yahoo Finance
Kulicke & Soffa Industries Inc (KLIC) Stock Price and Basic Information | MarketWatch
Loading social stream, please wait...