
Kennametal Inc. (KMT): Price and Financial Metrics
KMT Price/Volume Stats
| Current price | $25.52 | 52-week high | $30.60 |
| Prev. close | $25.19 | 52-week low | $22.08 |
| Day low | $25.19 | Volume | 541,800 |
| Day high | $25.73 | Avg. volume | 645,834 |
| 50-day MA | $24.49 | Dividend yield | 3.24% |
| 200-day MA | $24.39 | Market Cap | 2.01B |
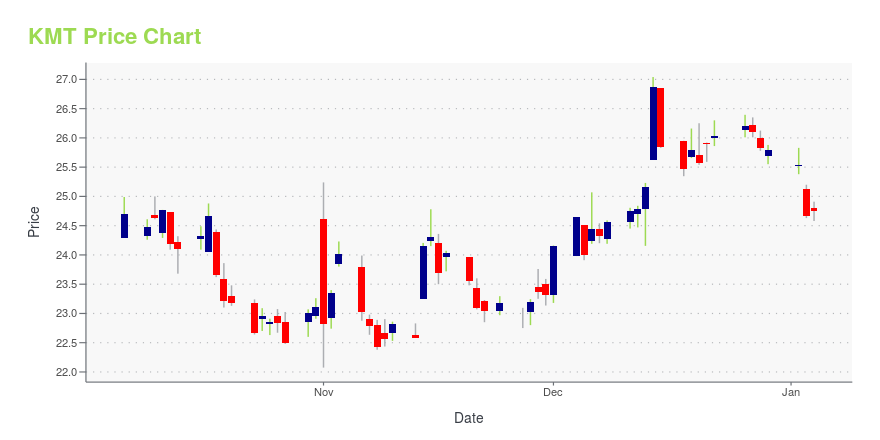
KMT Stock Price Chart Interactive Chart >
Kennametal Inc. (KMT) Company Bio
Kennametal Inc. manufactures and supplies tooling, engineered components, and advanced materials consumed in production processes worldwide. The company operates in two segments, Industrial and Infrastructure. The company was founded in 1938 and is based in Latrobe, Pennsylvania.
Latest KMT News From Around the Web
Below are the latest news stories about KENNAMETAL INC that investors may wish to consider to help them evaluate KMT as an investment opportunity.
3 Magnificent High-Yield Dividend Stocks to Buy for 2024These three stocks have income and growth potential for next year and beyond. |
Market Participants Recognise Kennametal Inc.'s (NYSE:KMT) EarningsWith a median price-to-earnings (or "P/E") ratio of close to 17x in the United States, you could be forgiven for... |
Strength Seen in Kennametal (KMT): Can Its 6.8% Jump Turn into More Strength?Kennametal (KMT) witnessed a jump in share price last session on above-average trading volume. The latest trend in earnings estimate revisions for the stock doesn't suggest further strength down the road. |
Kennametal Named Among Newsweek's Most Responsible CompaniesKennametal Inc. (NYSE: KMT) announced today that it has been named one of America's Most Responsible Companies 2024 by Newsweek. Ranked 70 out of 600 companies. This acknowledgement reflects Kennametal's unwavering commitment to the environment, ethical business practices and corporate social responsibility. |
Kennametal (NYSE:KMT) Will Be Hoping To Turn Its Returns On Capital AroundWhat financial metrics can indicate to us that a company is maturing or even in decline? Businesses in decline often... |
KMT Price Returns
| 1-mo | 9.20% |
| 3-mo | 6.98% |
| 6-mo | 3.34% |
| 1-year | -9.95% |
| 3-year | -21.01% |
| 5-year | -15.99% |
| YTD | 0.54% |
| 2023 | 10.48% |
| 2022 | -30.97% |
| 2021 | 1.20% |
| 2020 | 1.08% |
| 2019 | 13.49% |
KMT Dividends
| Ex-Dividend Date | Type | Payout Amount | Change | ||||||
|---|---|---|---|---|---|---|---|---|---|
| Loading, please wait... | |||||||||
Continue Researching KMT
Want to do more research on Kennametal Inc's stock and its price? Try the links below:Kennametal Inc (KMT) Stock Price | Nasdaq
Kennametal Inc (KMT) Stock Quote, History and News - Yahoo Finance
Kennametal Inc (KMT) Stock Price and Basic Information | MarketWatch
Loading social stream, please wait...