Knight-Swift Transportation Holdings Inc. (KNX): Price and Financial Metrics
KNX Price/Volume Stats
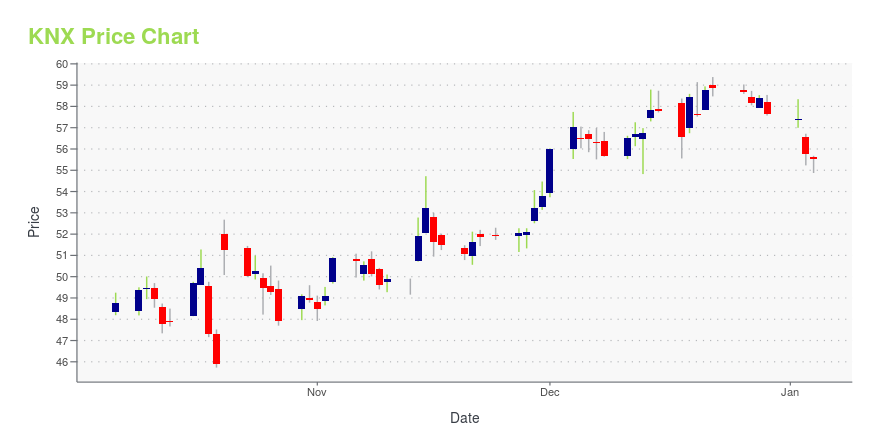
Current price | $54.99 | 52-week high | $64.35 |
Prev. close | $56.69 | 52-week low | $43.53 |
Day low | $54.53 | Volume | 3,519,400 |
Day high | $56.48 | Avg. volume | 1,949,395 |
50-day MA | $55.95 | Dividend yield | 1% |
200-day MA | $54.20 | Market Cap | 8.86B |
KNX Stock Price Chart Interactive Chart >
KNX POWR Grades
- Momentum is the dimension where KNX ranks best; there it ranks ahead of 67.64% of US stocks.
- KNX's strongest trending metric is Growth; it's been moving down over the last 179 days.
- KNX ranks lowest in Growth; there it ranks in the 9th percentile.
KNX Stock Summary
- KNX has a higher market value than 83.12% of US stocks; more precisely, its current market capitalization is $8,829,274,900.
- The volatility of KNIGHT-SWIFT TRANSPORTATION HOLDINGS INC's share price is greater than that of merely 13.17% US stocks with at least 200 days of trading history.
- KNIGHT-SWIFT TRANSPORTATION HOLDINGS INC's shareholder yield -- a measure of how much capital is returned to stockholders via dividends and buybacks -- is 6.09%, greater than the shareholder yield of 74.74% of stocks in our set.
- Stocks with similar financial metrics, market capitalization, and price volatility to KNIGHT-SWIFT TRANSPORTATION HOLDINGS INC are UHS, BH, AMED, IP, and NHC.
- Visit KNX's SEC page to see the company's official filings. To visit the company's web site, go to knight-swift.com.
KNX Valuation Summary
- In comparison to the median Industrials stock, KNX's EV/EBIT ratio is 29.94% lower, now standing at 11.
- KNX's price/sales ratio has moved up 0.7 over the prior 151 months.
Below are key valuation metrics over time for KNX.
Stock | Date | P/S | P/B | P/E | EV/EBIT |
---|---|---|---|---|---|
KNX | 2023-05-19 | 1.2 | 1.3 | 13.2 | 11.0 |
KNX | 2023-05-18 | 1.2 | 1.3 | 13.3 | 11.1 |
KNX | 2023-05-17 | 1.2 | 1.3 | 13.5 | 11.2 |
KNX | 2023-05-16 | 1.2 | 1.3 | 13.3 | 11.1 |
KNX | 2023-05-15 | 1.3 | 1.3 | 13.6 | 11.3 |
KNX | 2023-05-12 | 1.3 | 1.3 | 13.8 | 11.4 |
KNX Growth Metrics
- The 3 year cash and equivalents growth rate now stands at 235.1%.
- The 5 year net cashflow from operations growth rate now stands at 65.72%.
- Its 2 year revenue growth rate is now at 38.57%.

The table below shows KNX's growth in key financial areas (numbers in millions of US dollars).
Date | Revenue | Operating Cash Flow | Net Income to Common Stock |
---|---|---|---|
2022-09-30 | 7,501.818 | 1,471.824 | 877.24 |
2022-06-30 | 7,247.424 | 1,450.633 | 888.623 |
2022-03-31 | 6,601.994 | 1,340.9 | 821.935 |
2021-12-31 | 5,998.019 | 1,190.153 | 743.388 |
2021-09-30 | 5,459.121 | 1,082.15 | 631.101 |
2021-06-30 | 5,027.082 | 995.789 | 546.981 |
KNX's Quality Factors
The “Quality” component of the POWR Ratings focuses on 31 different factors of a companies fundamentals and operational strength. Here are some key insights as we drill into the specifics of these quality attributes.- KNX has a Quality Grade of C, ranking ahead of 56.89% of graded US stocks.
- KNX's asset turnover comes in at 0.606 -- ranking 41st of 137 Transportation stocks.
- FDX, SAIA, and RRTS are the stocks whose asset turnover ratios are most correlated with KNX.
The table below shows KNX's key quality metrics over time.
Period | Asset Turnover | Gross Margin | ROIC |
---|---|---|---|
2021-09-30 | 0.606 | 0.610 | 0.185 |
2021-06-30 | 0.588 | 0.609 | 0.189 |
2021-03-31 | 0.565 | 0.618 | 0.170 |
2020-12-31 | 0.557 | 0.614 | 0.149 |
2020-09-30 | 0.551 | 0.599 | 0.126 |
2020-06-30 | 0.553 | 0.582 | 0.104 |
KNX Price Target
For more insight on analysts targets of KNX, see our KNX price target page. And for a list of of all stocks sorted by upside potential based on analyst target price, see our Top Price Target page.
Average Price Target | $60.39 | Average Broker Recommendation | 1.57 (Moderate Buy) |
Knight-Swift Transportation Holdings Inc. (KNX) Company Bio
Knight Transportation is a provider of multiple truckload transportation services using a nationwide network of service centers in the U.S. to serve customers throughout North America. The company was founded in 1989 and is based in Phoenix, Arizona.
Latest KNX News From Around the Web
Below are the latest news stories about KNIGHT-SWIFT TRANSPORTATION HOLDINGS INC that investors may wish to consider to help them evaluate KNX as an investment opportunity.
Knight-Swift Transportation Holdings' (NYSE:KNX) investors will be pleased with their decent 50% return over the last three yearsVanguard founder Jack Bogle helped spearhead the low-cost index fund, putting average returns within reach of every... |
Knight-Swift (KNX) Q1 Earnings: Taking a Look at Key Metrics Versus EstimatesWhile the top- and bottom-line numbers for Knight-Swift (KNX) give a sense of how the business performed in the quarter ended March 2023, it could be worth looking at how some of its key metrics compare to Wall Street estimates and year-ago values. |
Knight-Swift Transportation Holdings' (NYSE:KNX) Shareholders Will Receive A Bigger Dividend Than Last YearThe board of Knight-Swift Transportation Holdings Inc. ( NYSE:KNX ) has announced that it will be paying its dividend... |
Knight-Swift Transportation Holdings Inc. Announces Quarterly Cash DividendPHOENIX, April 28, 2023--Knight-Swift Transportation Holdings Inc. (NYSE: KNX) (the "Company" or "Knight-Swift") announced today that its board of directors ("the Board") has declared the Company’s quarterly cash dividend of $0.14 per share of common stock. The Company's quarterly dividends are pursuant to a cash dividend policy approved by the Board. The actual declaration of future cash dividends, and the establishment of record and payment dates is subject to final determination by the Board |
Knight-Swift Transportation Holdings Inc. Issues 2022 Sustainability ReportPHOENIX, April 27, 2023--Knight-Swift Transportation Holdings Inc. (NYSE: KNX) ("Knight-Swift"), announced the release of its 2022 Sustainability Report, detailing its Environmental, Social and Governance (ESG) performance. The report highlights a 3.9% fleet emissions reduction (g/mile) from 2019 and is on track to meet its short-term goal of 5% by 2025. Other notable developments included increased pilot programming for low-to-no emission vehicles, exceptional growth in women in leadership, and |
KNX Price Returns
1-mo | -4.03% |
3-mo | -5.81% |
6-mo | -2.81% |
1-year | 14.13% |
3-year | 35.49% |
5-year | 37.25% |
YTD | 5.18% |
2022 | -13.20% |
2021 | 46.82% |
2020 | 17.64% |
2019 | 44.01% |
2018 | -42.30% |
KNX Dividends
Ex-Dividend Date | Type | Payout Amount | Change | ||||||
---|---|---|---|---|---|---|---|---|---|
Loading, please wait... |
Continue Researching KNX
Want to see what other sources are saying about Knight-Swift Transportation Holdings Inc's financials and stock price? Try the links below:Knight-Swift Transportation Holdings Inc (KNX) Stock Price | Nasdaq
Knight-Swift Transportation Holdings Inc (KNX) Stock Quote, History and News - Yahoo Finance
Knight-Swift Transportation Holdings Inc (KNX) Stock Price and Basic Information | MarketWatch
Loading social stream, please wait...