Kilroy Realty Corporation (KRC): Price and Financial Metrics
KRC Price/Volume Stats
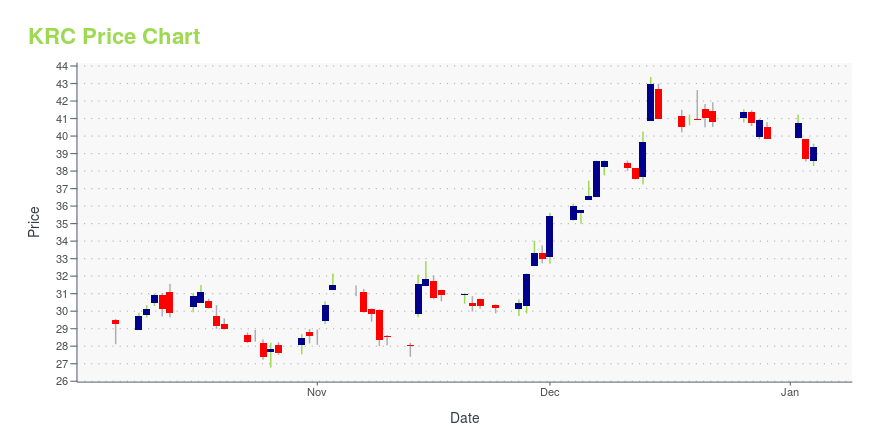
Current price | $36.59 | 52-week high | $43.47 |
Prev. close | $35.75 | 52-week low | $25.99 |
Day low | $36.34 | Volume | 1,692,267 |
Day high | $37.46 | Avg. volume | 1,156,727 |
50-day MA | $30.55 | Dividend yield | 6.1% |
200-day MA | $31.73 | Market Cap | 4.29B |
KRC Stock Price Chart Interactive Chart >
KRC POWR Grades
- KRC scores best on the Value dimension, with a Value rank ahead of 70.46% of US stocks.
- KRC's strongest trending metric is Growth; it's been moving down over the last 177 days.
- KRC's current lowest rank is in the Growth metric (where it is better than 17.81% of US stocks).
KRC Stock Summary
- KRC's one year PEG ratio, measuring expected growth in earnings next year relative to current common stock price is 367.74 -- higher than 91.61% of US-listed equities with positive expected earnings growth.
- Of note is the ratio of KILROY REALTY CORP's sales and general administrative expense to its total operating expenses; only 7.47% of US stocks have a lower such ratio.
- The ratio of debt to operating expenses for KILROY REALTY CORP is higher than it is for about 92.23% of US stocks.
- If you're looking for stocks that are quantitatively similar to KILROY REALTY CORP, a group of peers worth examining would be EPRT, CUBE, DEA, ADC, and SRC.
- KRC's SEC filings can be seen here. And to visit KILROY REALTY CORP's official web site, go to www.kilroyrealty.com.
KRC Valuation Summary
- KRC's price/earnings ratio is 17.2; this is 39.22% lower than that of the median Real Estate stock.
- KRC's EV/EBIT ratio has moved up 7.5 over the prior 243 months.
Below are key valuation metrics over time for KRC.
Stock | Date | P/S | P/B | P/E | EV/EBIT |
---|---|---|---|---|---|
KRC | 2023-11-15 | 3.3 | 0.7 | 17.2 | 24.9 |
KRC | 2023-11-14 | 3.2 | 0.7 | 17.0 | 24.8 |
KRC | 2023-11-13 | 2.9 | 0.6 | 15.1 | 23.5 |
KRC | 2023-11-10 | 2.9 | 0.6 | 15.4 | 23.7 |
KRC | 2023-11-09 | 2.9 | 0.6 | 15.3 | 23.7 |
KRC | 2023-11-08 | 3.1 | 0.6 | 16.1 | 24.2 |
KRC Growth Metrics
- Its year over year revenue growth rate is now at 7.91%.
- Its 4 year net income to common stockholders growth rate is now at 45.99%.
- The 4 year revenue growth rate now stands at 26.78%.

The table below shows KRC's growth in key financial areas (numbers in millions of US dollars).
Date | Revenue | Operating Cash Flow | Net Income to Common Stock |
---|---|---|---|
2022-12-31 | 1,096.987 | 592.235 | 232.615 |
2022-09-30 | 1,073.728 | 593.073 | 227.636 |
2022-06-30 | 1,030.096 | 578.886 | 194.907 |
2022-03-31 | 984.895 | 550.91 | 183.641 |
2021-12-31 | 955.04 | 516.403 | 628.144 |
2021-09-30 | 923.287 | 499.17 | 659.14 |
KRC's Quality Factors
The “Quality” component of the POWR Ratings focuses on 31 different factors of a companies fundamentals and operational strength. Here are some key insights as we drill into the specifics of these quality attributes.- KRC has a Quality Grade of C, ranking ahead of 48.81% of graded US stocks.
- KRC's asset turnover comes in at 0.089 -- ranking 234th of 442 Trading stocks.
- PNNT, ARI, and LOAN are the stocks whose asset turnover ratios are most correlated with KRC.
The table below shows KRC's key quality metrics over time.
Period | Asset Turnover | Gross Margin | ROIC |
---|---|---|---|
2021-09-30 | 0.089 | 0.724 | 0.055 |
2021-06-30 | 0.090 | 0.725 | 0.057 |
2021-03-31 | 0.091 | 0.726 | 0.056 |
2020-12-31 | 0.091 | 0.725 | 0.020 |
2020-09-30 | 0.093 | 0.722 | 0.019 |
2020-06-30 | 0.095 | 0.720 | 0.019 |
KRC Price Target
For more insight on analysts targets of KRC, see our KRC price target page. And for a list of of all stocks sorted by upside potential based on analyst target price, see our Top Price Target page.
Average Price Target | $78.20 | Average Broker Recommendation | 1.59 (Moderate Buy) |
Kilroy Realty Corporation (KRC) Company Bio
Kilroy Realty Corporation focuses in building its portfolio of office, industrial, R&D, and multi-purpose properties. The company was founded in 1947 and is based in Los Angeles, California.
Latest KRC News From Around the Web
Below are the latest news stories about KILROY REALTY CORP that investors may wish to consider to help them evaluate KRC as an investment opportunity.
Here's Why Kilroy Realty (KRC) Is a Great 'Buy the Bottom' Stock NowKilroy Realty (KRC) appears to have found support after losing some value lately, as indicated by the formation of a hammer chart. In addition to this technical chart pattern, strong agreement among Wall Street analysts in revising earnings estimates higher enhances the stock's potential for a turnaround in the near term. |
How Much Upside is Left in Kilroy Realty (KRC)? Wall Street Analysts Think 29.35%The average of price targets set by Wall Street analysts indicates a potential upside of 29.4% in Kilroy Realty (KRC). While the effectiveness of this highly sought-after metric is questionable, the positive trend in earnings estimate revisions might translate into an upside in the stock. |
KRC vs. STAG: Which Stock Should Value Investors Buy Now?KRC vs. STAG: Which Stock Is the Better Value Option? |
Q3 2023 Kilroy Realty Corp Earnings CallQ3 2023 Kilroy Realty Corp Earnings Call |
Kilroy Realty Corp (KRC) Q3 2023 Earnings: A Comprehensive ReviewInsights into the financial performance, achievements, and challenges of Kilroy Realty Corp (KRC) in Q3 2023 |
KRC Price Returns
1-mo | 17.13% |
3-mo | -1.10% |
6-mo | 26.64% |
1-year | -0.40% |
3-year | -34.24% |
5-year | -37.23% |
YTD | -0.23% |
2022 | -39.25% |
2021 | 19.30% |
2020 | -29.18% |
2019 | 36.76% |
2018 | -13.54% |
KRC Dividends
Ex-Dividend Date | Type | Payout Amount | Change | ||||||
---|---|---|---|---|---|---|---|---|---|
Loading, please wait... |
Continue Researching KRC
Want to see what other sources are saying about Kilroy Realty Corp's financials and stock price? Try the links below:Kilroy Realty Corp (KRC) Stock Price | Nasdaq
Kilroy Realty Corp (KRC) Stock Quote, History and News - Yahoo Finance
Kilroy Realty Corp (KRC) Stock Price and Basic Information | MarketWatch
Loading social stream, please wait...